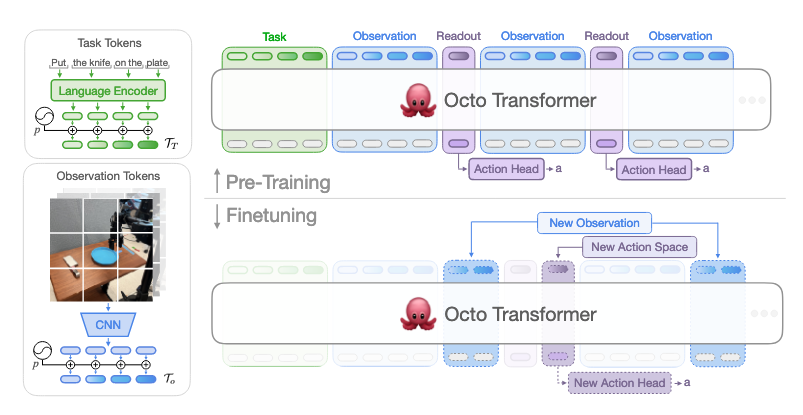
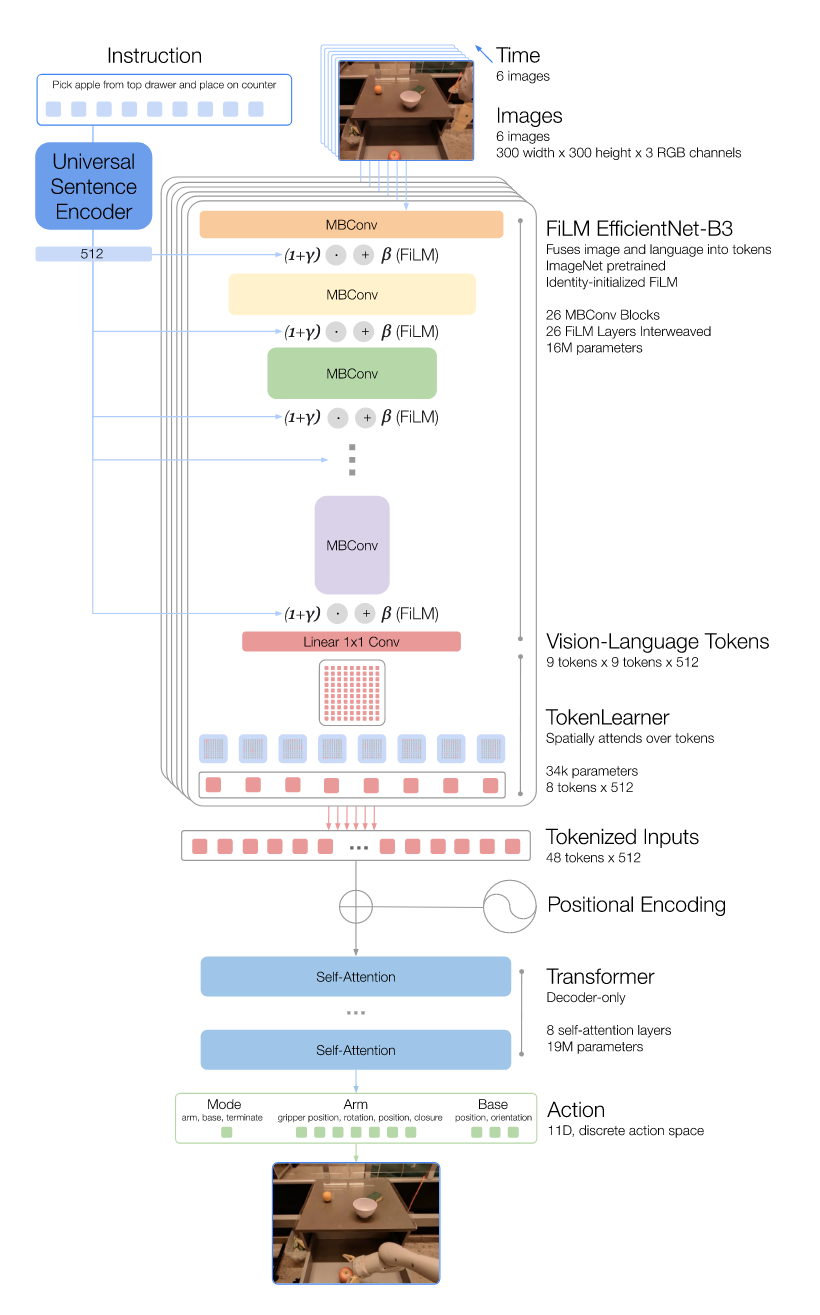
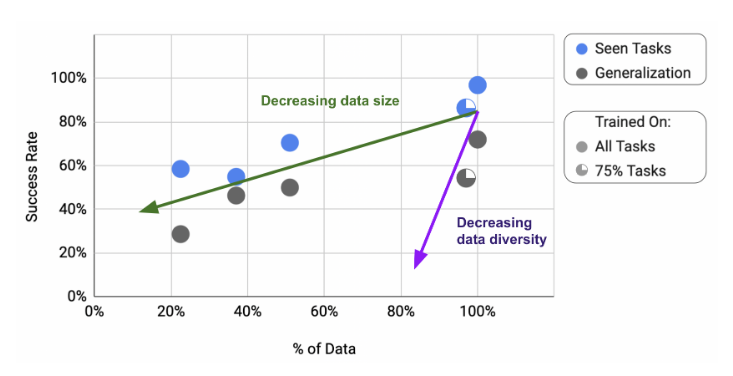
Octo is a transformer-based policy with modular tokenizers (language via T5, images via CNN patches), blockwise masking, and readout tokens, trained on 800k multi-robot trajectories.
Actions are generated through a diffusion head that produces continuous, multimodal, chunked predictions, enabling precise control and broad generalization.
It achieves state-of-the-art zero-shot performance across 7 robots and allows efficient finetuning to new sensors and action spaces, while being fully open-source.
Category
Simple Analogy
Actual Tokenization
Language
[Sentence]
[l₁, l₂, l₃, …] → multiple tokens from a tokenized sentence
Goal Image
[Goal]
[g₁, g₂, g₃, …] → image split into patches
Observation (time t)
[Observation]
[oₜ¹, oₜ², oₜ³, …] → camera frames/sensors tokenized into patches
Readout Token
[ ] (empty slot)
[TR,t] → one per timestep, reserved for predicting actions
Time t-1: [l][g][o_{t-1}][TR,t-1]
Time t: [l][g][o_t][TR,t]
Time t+1: [l][g][o_{t+1}][TR,t+1]
[TR,t-1], [TR,t], [TR,t+1] ──► Diffusion head ──► [a_t, a_{t+1}, …]
GRPs aim for low-level visuomotor control across tasks, environments, and robotic systems.
Existing models often have restricted inputs (e.g., a single camera), lack efficient finetuning to new domains, and importantly, largest models are not publicly available.
Octo = modular, efficient, open-source GRP:
A transformer + diffusion policy trained on large-scale multi-robot data that adapts quickly with little in-domain data to new sensors and action spaces, enabling broad generalization.
Mees, O., Ghosh, D., Pertsch, K., Black, K., Walke, H. R., Dasari, S., Hejna, J., Kreiman, T., Xu, C., & Luo, J. (2024). Octo: An open-source generalist robot policy. First Workshop on Vision-Language Models for Navigation and Manipulation at ICRA 2024.
Inductive learning (귀납적 학습): learning a general function or rule (possibly incorrect) from specific input-output pairs
Bottom to top
Specific to general
Deductive learning (연역적 학습): going from a general rule to a new specific rule that is logically entailed, but is useful because it allows more efficient processing
to predict a continuous value as the output for a given input
weather temperature: solar radiation, wind direction and speed, geographic location..
how to predict the output value of a new data instance on the basis of observed features from the existing data (historical examples) in the problem domain.
Elements
Collection of existing or historical data samples which are represented by a set of attributes or independent variables
The output values of the existing data samples
the output variable or attribute must be continuous
Regressor: a function describes the relationship between the attributes of a data sample and the output.
takes the values of attributes of a data sample and predicts the output value of this given data sample.
Predict the fuel price using the Brent crude oil price, financial performance of the oil related companies (cash flow, projects lined up, etc.) and/or geopolitical risks (OPEC announcements, government sanctions, etc.)
Predict the house price of a suburb from the suburb's profile
Predict the blood pressure of a patient based on the patient's health profile
Predict the electricity price using temperature, demand and time.
to predict discrete or categorical value as the output for a given input
Pass or Failed given learning outcomes, student ID, prior learning, attitude, commitment and attendance.
how to put a new data instance into one of predefined categories or classes on the basis of observed features from the existing data in the problem domain.
Elements
Collection of existing or historical data samples with class labels
Predefined categories or classes
Adequate samples in each category or class in the existing or historical data.
the fundamental quantity in information theory. It is a measure of the uncertainty of a random variable.
the fundamental quantity in information theory. It is a measure of the uncertainty of a random variable
A more homogeneous node with a clear majority class has low impurity and low entropy, while a more mixed distribution of classes has high impurity and high entropy.
The information gain from the attribute test on (split on A) is the expected reduction in entropy.
Information gain computes the difference between entropy before the split and average entropy after the split of the dataset based on given attribute values
combines multiple weak decision tree models to create a stronger learning model.
two types of randomness are introduced to ensure that the individual decision trees are diverse and less prone to overfitting.
Random sampling of the input data
Bootstraping:
involves sampling with replacement 복원추출 (meaning that some instances appearing multiple times and others not appearing) from the original dataset, creating a new dataset.
each decision tree is trained on a slightly different set of data points, reducing the likelihood of overfitting.
Random selection of features at each split
At each split in each decision tree, a random subset of features is considered when determining the best split.
each tree in the ensemble does not rely on the same set of features for making decisions, resulting in a more diverse set of trees.
By considering only a subset of features at each split, the model is less likely to be influenced by a small number of dominant features, leading to a more balanced and accurate prediction.
구분
데이터 무작위성 (Bootstrapping)
속성 무작위성 (Feature Subset Selection)
적용 위치
트리 훈련 데이터 선택 단계
트리의 각 분할(split) 단계
방법
원본 데이터셋에서 복원 추출(with replacement)로 샘플링하여 새로운 학습용 부분집합 생성
전체 속성 중 무작위로 일부 속성만 선택 후, 그 속성들로만 분할 기준 탐색
특징
- 각 나무가 다른 데이터 포인트로 학습됨 - 일부 샘플은 여러 번 등장, 일부는 제외될 수 있음
aggregating the predictions of all individual decision trees in the forest.
Majority voting: For classification, Count the number of times each class is predicted by the individual decision trees. The class with the highest count is considered as the final prediction.
Averaging: For regression, Calculate the mean of the predictions made by the individual decision trees. The mean value is considered as the final prediction.
a learning technique that finds a linear relationship between input variables and the target variable based on a fundamental assumption that there is a linear relationship between input variables and the target variable
e.g. the input variables (engine size, weight and car age) ➡️ target variable (car fuel efficiency)
assumption that there is a linear relationship
A linear regression technique learns a set of coefficients to estimate the linear relationship between x and y, denoted as hw, which can be represented by the following equation.
h_w(x)=w0+w1x1+...+wnxn=∑i=0nwixi
w is a weight vector
y^=∑i=0nwixi
linear regression model is an approximate function between the input variables and the target variable, there will be an error between the output of the model and the actual output value for a data sample
This error can be represented by a loss function, which calculates the mean square error
to find the best linear relationship hwthat best fits the training data of m data samples.
makes the loss to be minimised.
to find the best weight vector w∗, such that for a given training dataset of m data samples.
w∗=argminwLoss(hw)
gradient descent: continuously resamples the gradient of the weight coefficients in the opposite direction depending on the weight w.
Until the loss function Loss(hw) reaches the global minimum
to change the individual components of w a little bit in the direction that minimises Loss(hw), and to do this many times.
wi←wi+α∑j=1mxj,i(yj−hw(xj))
α: the step size, the learning rate
Training model: the process of iteratively updating weights with a learning rate to minimise loss, where the final weight vector defines the model used for predicting new data.
use regularisation on a multivariate linear function to avoid overfitting.
Batch gradient descent: consider the entire training dataset (X,y) at once.
w0←w0+α∑j=1m(yj−(w0+w1xj))
w1←w1+α(∑j=1m(yj−(w0+w1xj))⋅xj)
Stochastic gradient descent (SGD): consider only a single training data sample (xj,yj) at a time.
w0←w0+α(yj−(w0+w1xj))
w1←w1+α((yj−(w0+w1xj))⋅xj)
can be used in an online setting, where new data is coming one at a time, or offline, where we cycle through the same data as many times as is necessary, taking a step after considering each single example.
With a fixed learning rate α, the stochastic version does not guarantee convergence.
often faster than batch gradient descent.
With a schedule of decreasing learning rates (SA), the stochastic version does guarantee convergence.
These update rules are derived as the next weight update equations by taking the partial derivatives of the loss function with respect to w0 and w1.
an extension of linear regression in such a way that the output of a linear regression model goes through a logistic function
y(x)=1+e−x1
The output value of this logistic function is between 0 and 1.
0 is for certainly being labeled "0" and 1 is for certainly being labeled "1", and a value between 0 and 1 represents the probability of being labeled "1"
a logistic regression model: a linear regression model + a logistic function
Conceptually trivial: Given a set of N examples and a query xq, iterate through the examples, measure the distance to xq from each one, and keep the best k.
NN(k,xq)'s time complexity is O(N), N is the number of examples in the training dataset.
Use a k-dimensional tree: a balanced binary tree with an arbitrary number of dimensions.
Time complexity can be improved to O(logN)
appropriate only when there are many more examples than dimensions
It works well with up to 10 dimensions with thousands of examples.
Use a Hash table with a locality-sensitive hash (LSH)
the largest possible distance to example points, helping to improve generalization
SVMs create a linear separating hyperplane
kernel trick: to embed the data into a higher-dimensional space
Often data that are not linearly separable in the original input space are easily separable in a higher-dimensional space
In general (excepted some special cases) if we have N data points then they will always be separable in spaces of N dimensions or more
SVMs are a nonparametric method
retain training examples and potentially need to store them all
In practice, they often end up retaining only a small fraction of examples
have the flexibility to represent complex functions, but they are resistant to overfitting
not usually expect to find a linear separator in the input space x, but we can find linear separators in the high-dimensional feature space F(x) simply by replacing (xjxk) in
argmaxα∑jαj−21∑j,kαjαkyjyk(xj⋅xk)
with K(xj,xk)=F(xj)⋅F(xk)
F(xj)⋅F(xk) can often be computed without first computing F for each point.
In a higher dimensional feature space, which is created by transformation F(x), if we can express K(xj⋅xk)=F(xj)⋅F(xk), the kernel function K(xj⋅xk) can be applied to pairs of input data to evaluate dot product in some corresponding feature space.
kernel trick is to plug a kernel function K(xj⋅xk) into the dual optimisation problem to replace (xj⋅xk)
Optimal linear separators can be found efficiently in feature spaces with billions of (or, in some cases, infinitely many) dimensions.
we can learn in the higher-dimensional space, but we compute only kernel functions rather than the full list of features for each data point.
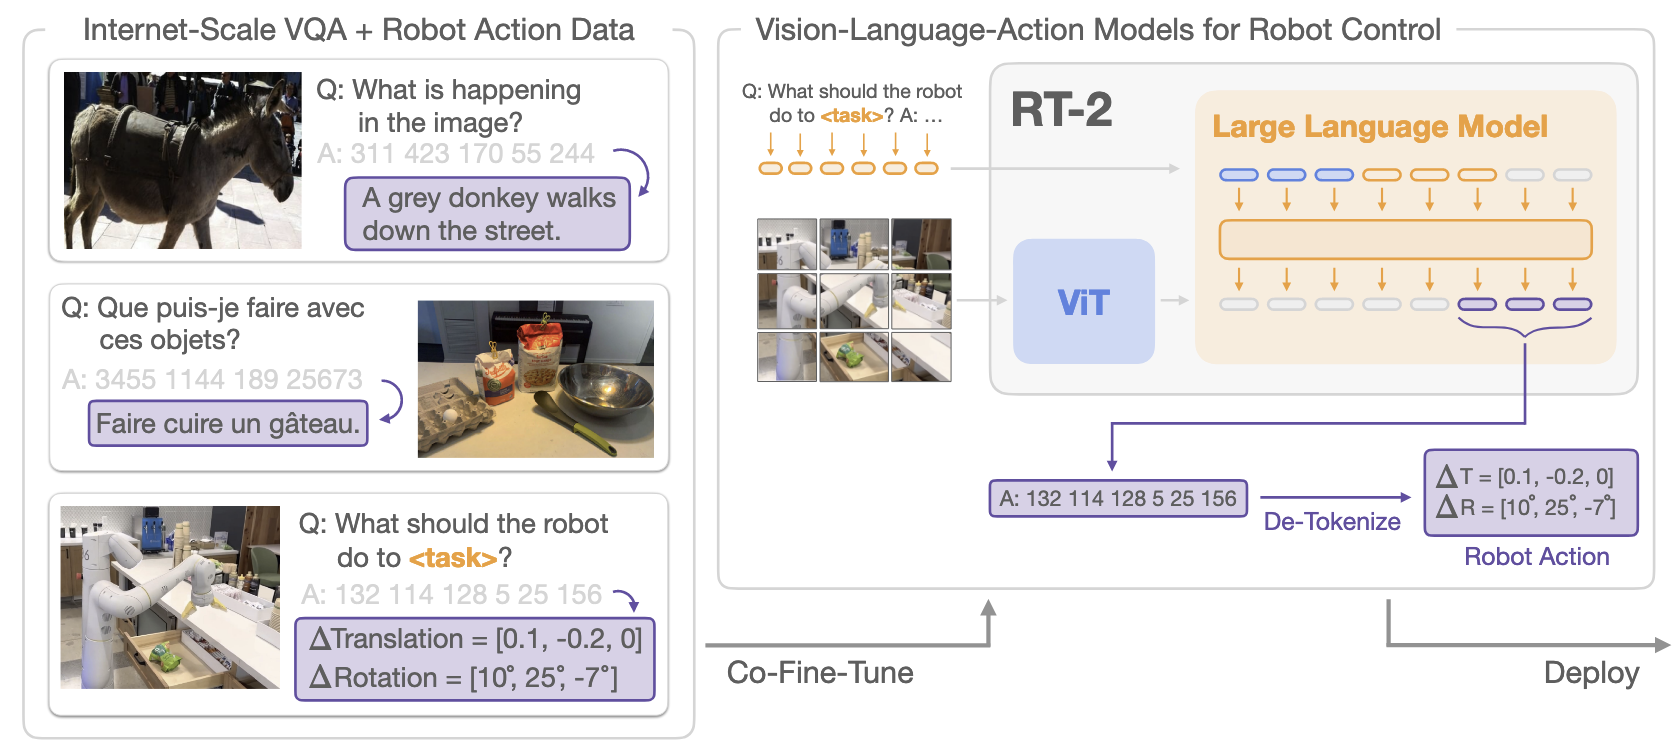
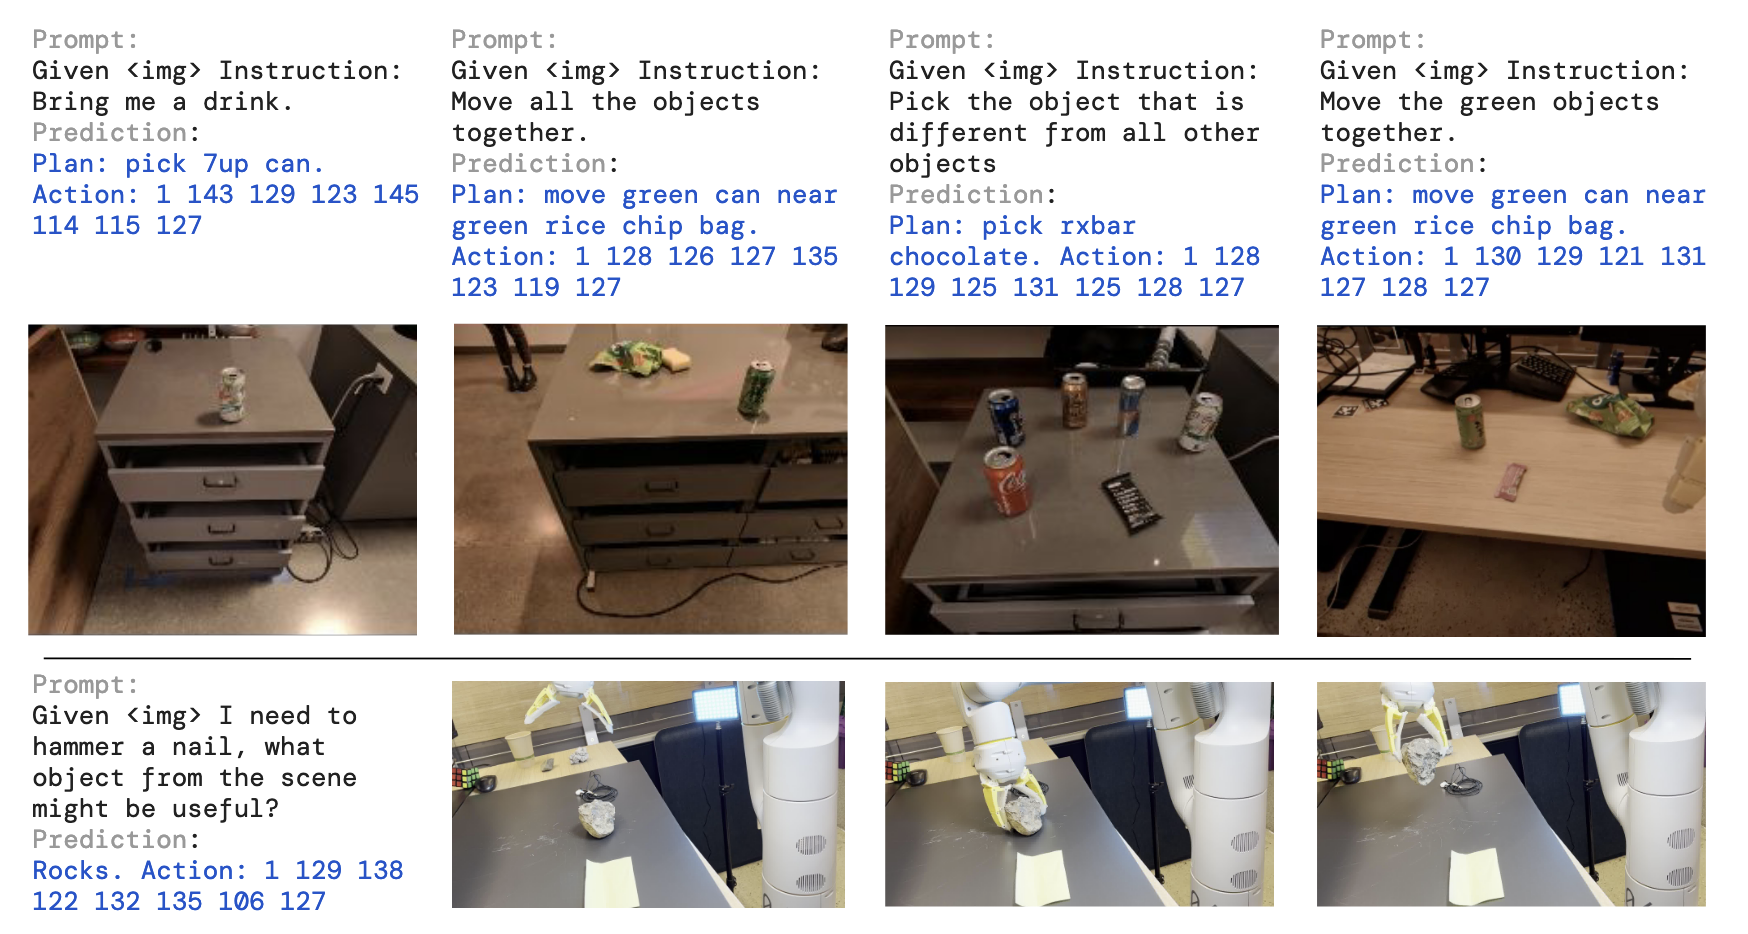
Symbol understanding (e.g., “move apple to 3 / heart / star”).
Reasoning (visual matching, simple math like “sum of two plus one”, multilingual commands).
Human recognition (e.g., “person with glasses”); none of these were present as low-level actions in robot data.
Chain-of-thought (CoT) variant adds a Plan step before actions → supports multi-stage semantic reasoning (e.g., pick a rock as an improvised hammer; pick an energy drink for a tired person).
Zitkovich, B., Yu, T., Xu, S., Xu, P., Xiao, T., Xia, F., Wu, J., Wohlhart, P., Welker, S., Wahid, A., Vuong, Q., Vanhoucke, V., Tran, H., Soricut, R., Singh, A., Singh, J., Sermanet, P., Sanketi, P. R., Salazar, G., Ryoo, M. S., Reymann, K., Rao, K., Pertsch, K., Mordatch, I., Michalewski, H., Lu, Y., Levine, S., Lee, L., Lee, T.-W. E., Leal, I., Kuang, Y., Kalashnikov, D., Julian, R., Joshi, N. J., Irpan, A., Ichter, B., Hsu, J., Herzog, A., Hausman, K., Gopalakrishnan, K., Fu, C., Florence, P., Finn, C., Dubey, K. A., Driess, D., Ding, T., Choromanski, K. M., Chen, X., Chebotar, Y., Carbajal, J., Brown, N., Brohan, A., Arenas, M. G., & Han, K. (2023). RT-2: Vision-Language-Action Models Transfer Web Knowledge to Robotic Control Proceedings of The 7th Conference on Robot Learning, Proceedings of Machine Learning Research. https://proceedings.mlr.press/v229/zitkovich23a.html
ViT (e.g., ViT-4B, ViT-22B) extracts image embeddings.
OSRT builds object-centric slot representations.
These are injected into the LLM embedding space (PaLM variants: 8B, 62B, 540B) for high-level abstraction and planning, with execution delegated to low-level policies (e.g., RT-1).
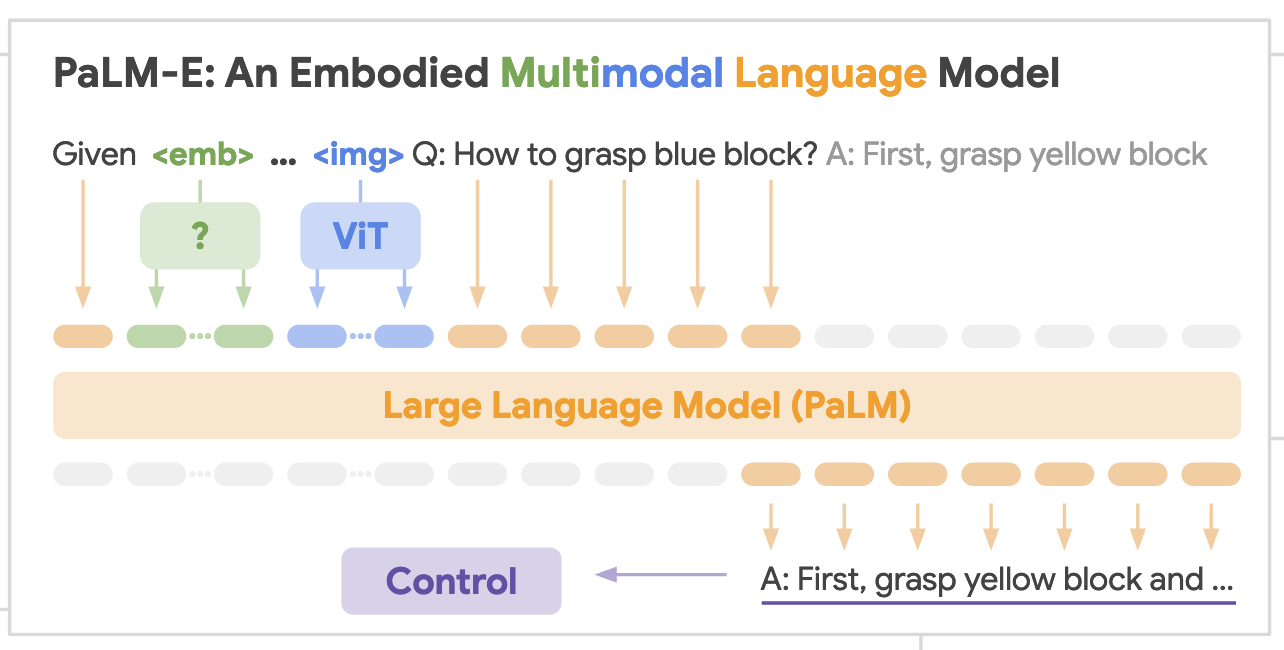
Build embodied language models by injecting continuous sensor inputs (images, states, other modalities) directly into a pretrained LLM’s embedding space, linking words ↔ percepts.
Inputs are multimodal sentences that interleave text tokens with encoded visual/state tokens; outputs are text (answers or high-level plans).
Start from a decoder-only, autoregressive LLM (PaLM) and condition on a prefix that mixes text and encoder-produced vectors.
Provide multiple encoder options:
State vectors (simplest).
ViT features with a learned projector ψ to match LLM embedding dimensionality.
Object-centric, 3D-aware OSRT (neural scene representations). Supports entity-label tokens (<obj j>) so the model can refer to specific objects in generated plans.
For planning/control, PaLM-E emits textual subgoals/skills drawn from a small skill vocabulary; a separate low-level policy executes them.
The system runs closed-loop: execute → observe → (re)plan; PaLM-E acts as a high-level policy sequencing low-level skills.
Why not text-only LLMs or affordance-only grounding?
Prior work that feeds only text to the LLM (and uses external affordance models) is insufficient when spatial layout matters.
PaLM-E instead grounds inside the LLM by injecting continuous observations, enabling direct plan generation while leveraging the LLM’s world knowledge.
Transfer via co-training: One model trained on mixed tasks/embodiments achieves higher performance than task-specialists; "full mixture" yields >2× gains (Fig. 3).
Few-shot/data efficiency: Solves robotics tasks with very few examples (e.g., 10–80 for Language-Table, 320 for TAMP). OSRT further improves data efficiency.
Mobile manipulation: End-to-end embodied planning works in real kitchens, robust to disturbances; PaLM-E beats PaLI (zero-shot) and QT-OPT/CLIP baselines on affordance/failure detection.
General V+L: The 562B generalist achieves state-of-the-art on OK-VQA and strong VQAv2/COCO without task-specific finetuning.
Language retention & scaling: Freezing LLM preserves language ability but can struggle on some robotics tasks; unfrozen + scale up significantly reduces catastrophic forgetting.
Emergent behaviors: Multimodal chain-of-thought and multi-image reasoning emerge in PaLM-E-562B, despite training on single-image prompts.
Driess, D., Xia, F., Sajjadi, M. S. M., Lynch, C., Chowdhery, A., Ichter, B., Wahid, A., Tompson, J., Vuong, Q., Yu, T., Huang, W., Chebotar, Y., Sermanet, P., Duckworth, D., Levine, S., Vanhoucke, V., Hausman, K., Toussaint, M., Greff, K., Zeng, A., Mordatch, I., & Florence, P. (2023). PaLM-E: An Embodied Multimodal Language Model Proceedings of the 40th International Conference on Machine Learning, Proceedings of Machine Learning Research. https://proceedings.mlr.press/v202/driess23a.html
Brohan, A., Brown, N., Carbajal, J., Chebotar, Y., Dabis, J., Finn, C., Gopalakrishnan, K., Hausman, K., Herzog, A., & Hsu, J. (2022). Rt-1: Robotics transformer for real-world control at scale. arXiv preprint arXiv:2212.06817.
The core of SayCan is using an LLM to decompose high-level instructions into low-level skills, and reinforcement-learned affordance value functions to evaluate whether each skill is feasible in the current environment.
The Say × Can structure is modular: different LLMs or affordance models can be swapped in, but each module’s inherent biases are carried into the system.
To mitigate limitations, loop-based strategies are essential — CoT and RLHF provide feedback loops for LLMs, while closed-loop feedback enables affordance functions to adapt during execution.
LLMs lack embodiment. They haven’t acted in the physical world, so using them for decision-making on a specific robot is unreliable.
LLMs don’t know robot’s abilities or state. They may split instructions into subtasks, but without context of capabilities and environment, plans can be irrelevant.
Prompting alone isn’t enough. Structured prompts help, but they don’t guarantee admissible or executable steps.
Limits: Inherits LLM biases; skill library is bottleneck; hard to react to skill failures.
Closed-loop extensions: Huang et al. use environment feedback + inner monologue for replanning.
Future directions: Expand/robustify skills, explore new grounding sources (non-robotic), test if natural language is the right ontology, combine planning + language, use LMs for policy pretraining.
ichter, b., Brohan, A., Chebotar, Y., Finn, C., Hausman, K., Herzog, A., Ho, D., Ibarz, J., Irpan, A., Jang, E., Julian, R., Kalashnikov, D., Levine, S., Lu, Y., Parada, C., Rao, K., Sermanet, P., Toshev, A. T., Vanhoucke, V., Xia, F., Xiao, T., Xu, P., Yan, M., Brown, N., Ahn, M., Cortes, O., Sievers, N., Tan, C., Xu, S., Reyes, D., Rettinghouse, J., Quiambao, J., Pastor, P., Luu, L., Lee, K.-H., Kuang, Y., Jesmonth, S., Joshi, N. J., Jeffrey, K., Ruano, R. J., Hsu, J., Gopalakrishnan, K., David, B., Zeng, A., & Fu, C. K. (2023). Do As I Can, Not As I Say: Grounding Language in Robotic Affordances Proceedings of The 6th Conference on Robot Learning, Proceedings of Machine Learning Research. https://proceedings.mlr.press/v205/ichter23a.html
In real world applications, data can be inconsistent, incomplete, and noisy.
Data Collection problems: when data is collected incorrectly
Incomplete Data: when information is missing
Data entry problems: when data is entered incorrectly
Contradictions in data: when the data says something in one place, and then says a different thing elsewhere in the dataset. We can think of this data as noisy.
Discrepancy in naming conventions: when data descriptions are unclear, people may misinterpret their meaning.
Duplicated records: when integrating data from different sources, the same data may get entered multiple times.
Data transmission problems: when data is sent between different people or databases or companies, things can get lost in the process.
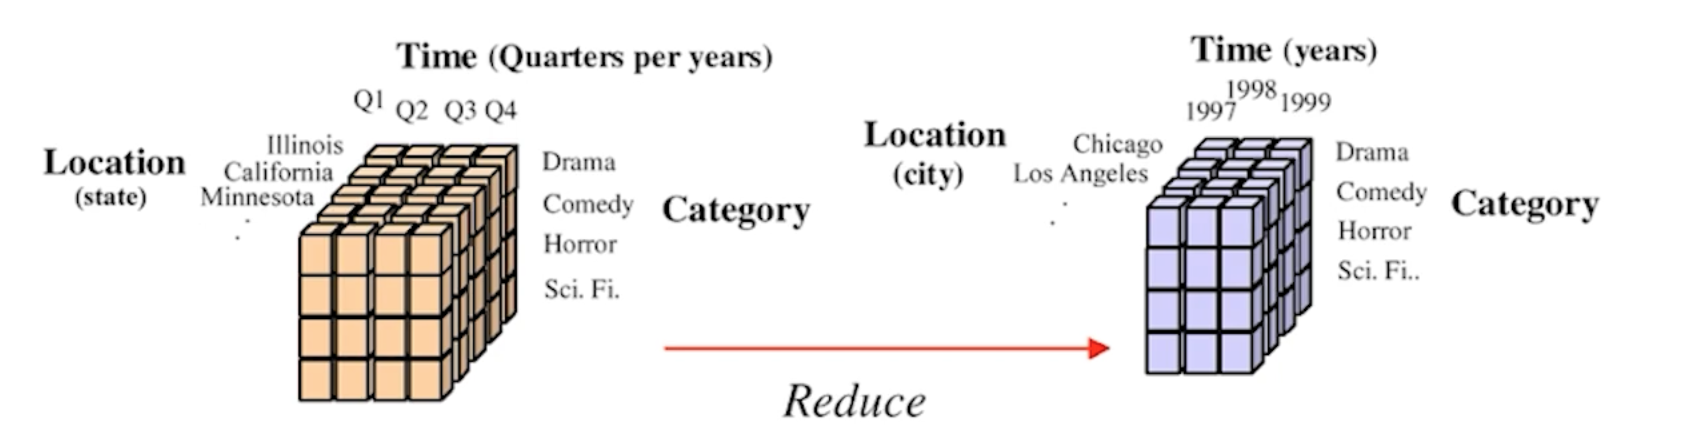
provides unified data by combining data from various heterogeneous data sources into a coherent data store
The sources can include flat files, databases or multiple data cubes.
Careful integration may help to avoid and reduce inconsistencies and redundancies in the final dataset.
Building an enterprise's data warehouse is considered one of the most popular data integration implementations.
Redundant attributes: An attribute (feature or column of a dataset) is called redundant if it can be derived from any other attribute or set of attributes.
In the process of data integration in data mining, the use of multiple data stores may lead to the problem of redundancy in data.
Dimension naming or inconsistencies in an attribute can also lead to redundancies in the dataset.
calculates the relative position within the original range and reflects it in the new range accordingly.
preserves the relationships between the original data values.
It will encounter an out-of-bounds error if a future input case for normalisation falls outside of the original data range for K.
Z-Score normalization
normalises attribute values using the average (i.e., mean) and standard deviation of K.
vn′=σK(vn−μK)
It converts the distance of a data point from the mean into a unitless measure.
is useful when there are outliers that dominate the min-max normalisation
is useful when the actual minimum and maximum of attribute K are unknown.
Decimal scaling normalization
The number of decimal points moved is based on the maximum absolute value of K.
vn′=10jvn
where j is the smallest integer such that max(∣vn′∣)<1.
divides all values by the power of 10 just larger than the maximum absolute value, bringing them into the range (−1,1).
Softmax normalization
a nonlinear transformation that yields an 's'-shaped curve that approaches 0 and 1 asymptotically.
New values will be mapped between 0 and 1 even if they are beyond the range of your existing data.
α=λ(σ/2π)ν−μ,ν′=1+e−α1
Center the data around the mean :: use (ν−μ)
Remove units by scaling with the standard deviation :: divide by σ.
Control how steep or flat the curve is :: adjust with λ.
Add (2π) as a conventional constant to better match the logistic curve with statistical distributions.
the formula naturally arises by centering at the mean, standardizing by the spread, letting the user control the slope, and refining with a scaling constant.
Sigmoid normalization
a nonlinear transformation similar to softmax. It ranges between −1 and 1 (asymptotically), and has a fixed linear portion within ±mu.
α=λ(σ/2π)ν−μ,ν′=1+e−α1−e−α
Center the data around the mean :: use (ν−μ)
Remove units by scaling with the standard deviation :: divide by σ.
Control how steep or flat the curve is :: adjust with λ.
Add (2π) as a conventional constant to refine scaling with respect to statistical distributions.
Apply the hyperbolic tangent :: map the result smoothly into the range [−1,1].
the formula naturally arises by centering at the mean, standardizing by spread, letting the user control the slope, and using tanh to compress all values into [−1,1].
Data discretisation is a form of numerosity reduction that transforms a continuous attribute into a categorical attribute.
Higher concept labels or a smaller number of intervals (i.e. binning) are used to replace the raw data in order to simplify the original data and increase the efficiency of mining.
Discretisation is very beneficial for generating concept hierarchies automatically, which allow data mining at multiple levels of data abstraction.
One or more concept hierarchy can be defined for the single attribute for accommodating the requirements of various users.
Salary
Age
➡️
Salary
Age
2000
20
-
[2000, 2900)
[20, 25)
2800
25
-
[2000, 2900)
[25, 30)
3500
23
-
[2900, 3800)
[20, 25)
2400
26
-
[2000, 2900)
[25, 30)
5600
32
-
[5600, 6500)
[30, 35)
4200
36
-
[3800, 4700)
[35, 40]
5000
39
-
[4700, 5600)
[35, 40]
5000
40
-
[4700, 5600)
[35, 40]
3400
35
-
[2900, 3800)
[35, 40]
3600
34
-
[2900, 3800)
[30, 35)
If dependent and independent variables have only a few values, a wide range of classification algorithms can be used.
feature subset selection or feature selection detects and removes weakly relevant, redundant, or irrelevant dimensions or attributes
to determine a minimum set of attributes so that the resulting probability distribution of the data classes is as near as possible to the original distribution obtained using all attributes.
Feature subset selection: uses only available subsets of the features to reduce the dimensionality of the data
Redundant features: Duplicates of all or much of the information present in one or more attributes.
the amount of sales tax paid / purchase price of a product
Irrelevant features: Contain no information that is important for the data mining process at hand.
the color of a product when predicting its price
While some redundant and irrelevant attributes can be eliminated immediately by considering the domain knowledge or common sense.
The ideal approach to feature selection is to try all possible subsets of features in the input for the data mining algorithm of interest, and then consider the subset that gives the best outcome.
Feature subset selection techniques
Brute-force approach
Embedded approaches:
Feature selection occurs naturally as part of the data mining algorithm.
The algorithm decides by itself which attributes are to be ignored.
Filter approaches:
Features are chosen before running the data mining algorithm by taking some of the approaches which are independent of the data mining process.
can be selected with pairwise correlation as low as possible.
Wrapper approaches:
consider the target data mining algorithm as a black box to determine the best subset of attributes.
Instead of evaluating all possible combinations, it intelligently searches only a subset to find a near-optimal feature set.
unsupervised techniques that does not use a class label
Singleton bucket: each of the buckets shows only a single frequency pair/attribute value
Equal-width histogram: divided into equal ranges
Equal-frequency(depth) histogram: each bucket has the similar number of data
Sampling
a large dataset to be denoted by a smaller random subset (or sample) of the data
often used in preliminary exploration as well as final analysis.
useful when processing the entire dataset is too large or expensive.
If the sample preserves the important properties of the original dataset (e.g., the mean), the sample is said to be representative
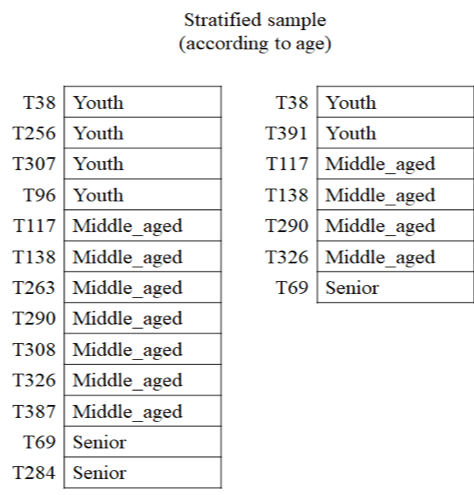
Simple random sampling: every data point has an equal probability of being chosen.
Sampling without replacement: once a data point is chosen, it cannot be selected again.
Sampling with replacement (bootstrap): the same data point can be picked multiple times, since it is placed back into the dataset after selection.
Cluster sampling: the dataset is divided into clusters (groups), and sampling is performed at the cluster level.
Stratified sampling: the dataset is split into strata (partitions), and random samples are drawn from each stratum. This is especially useful when the data is imbalanced, e.g., sampling customers across different age groups.