본문으로 건너뛰기

Full Stack JavaScript Developer | Half-time Open Sourcerer.

모든 저자 보기

FDA +007

· 약 7분

Classification and Prediction​

Classification​

classifies data based on the training set and the class labels and uses it in classifying new data

  • Model construction (learning)
  • Model evaluation (accuracy)
  • Model use (classification)

Prediction​

predicts categorical class labels based on unseen data

  • models continuous-valued functions

Classfication Methods​

  • Decision tree induction
  • Bayesian classification
  • Nearest neighbour classification, case-based reasoning
  • Neural networks
  • Support Vector Machines
  • Ensemble methods

Issues around classification and prediction​

  • Predictive accuracy
  • Speed and scalability
  • Robustness
  • Interpretability
  • 'Goodness' of classifier

Classification process​

Decision Tree​

  • Builds trees to describe data
  • Easy to translate into rules
  • Robust to niosy data
  • able to build disjunctive expressions
  • Inductive bias prefers small trees over larger.

Decision Tree Methodologies​

  • Itertative Dichotomiser 3 (ID3)
  • C4.5
  • Classification And Regression Trees (CART)
  • Chi-square Automatic Interaction Detection (CHAID)
  • Multivariate Adaptive Regression Splines (MARS)

Decision Tree Forms​

  • Balanced
    • each branch has the same depth from the root to leaves.
    • all nodes have the same number of splits
  • Deep
    • some nodes have different levels, wherein some of them are split into more branches.
  • Bushy
    • split into multi-way from the root
    • undesirable because the split may lead to small numbers of instance in each leaf node.

Entropy and Information Gain​

Entropy​

measures the amount of disorder / (im)purity in a collection of things. i.e. the unpredictability of the data.

Entropy(S)=−p+log2(p+)−p−log2(p−)Entropy(S) = -p_{+} log_2(p_{+}) - p_{-} log_2(p_{-})

  • Constructing a decision tree is all about finding an attribute that returns the highest information gain and the smallest entropy.
  • SS stands for total number of samples
  • P+P_{+} denotes the likelihood of a yes (positive) answer.
  • P−P_{-} denotes the likelihood of a no (negative) outcome.

E(S)=∑i=1c−pilog2(pi)E(S) = \sum_{i=1}^{c} -p_i log_2(p_i)

Information Gain​

measures how well a given attribute separates the training examples according to the target classification.

  • The larger the information gain is, the stronger the feature will be.

Gain(S,A)=Entropy(S)−∑v∈Values(A)∣Sv∣∣S∣Entropy(Sv)Gain(S,A) = Entropy(S) - \sum_{v \in Values(A)} \frac{|S_v|}{|S|} Entropy(S_v)

  • SS = set of training examples
  • AA = the particular attribute to be tested
  • Values(A)Values(A) = the set of values for the attribute A
  • SvS_v = subset of SS with attribute AA having value vvs

Iterative Dichotomiser 3​

  • constructs trees in a top-down manner.
  • check each instance attribute with a statistical test to see how well it alone classifies (splits) the training examples.
  • this becomes the root node.
  • descendent is created for each possible value of the attribute and training examples split to the appropriate descendent.
  • repeat the procedure for each descendent.
  • the algorithm is going to issue recursion on each of the partitions.
  • the output of this algorithm is the creation of a Model.
function id3 (examples, target, attrs):
create root node for tree

if examples all +ve, return root with label=+
if examples all -ve, return root with label=-
if attrs is empty
return root w/ label=most common value of target in examples else
else
A ← attribute from attrs that best splits examples
root ← A for each possible value, vi , in A
add a new branch below root corresp. to the test A = vi
examples_v ← the subset of examples with A = vi

if examples_vi is empty
add a leaf node below branch w/ label = most common value of target from examples
else below the branch add the subtree given by
id3(examples_vi , target, attrs - {A})

return root
  • ID3 can be seen as a search through a space of hypotheses for one that matches the training data.
  • It's a greedy search
  • Hypothesis space = all the possible trees
  • Simple to complex, hill climbing search
  • Complete search = decision tree can represent all possible hypotheses
  • Maintains only one current hypothesis
    • cannot find alternative decision trees
  • No backtracking, maybe stuck in local optima
  • Uses all training data at each step
    • less sensitive to errors in individual examples

Inductive Bias​

  • Shorter trees preferred
  • High information gain near the root
  • cos' simple to complex search

Issues with decision trees​

Overfitting training data​

  • occurs when a tree gives higher accuracy on the training data than another tree, but lower accuracy on the unseen data.
  • because the training data is noisy or not representative of the unseen data.
  • can measure how well the tree generalizes by checking error on test data.

Dividing the data​

  • Training set
    • used to build the initial model
    • may need to enrich the data to get enough of the special cases
  • Cross validation set
    • used to adjust the initial model
    • used to work out the correct values of parameters in model
    • models can be tweaked to be less dependent on idiosyncrasies in the training data to be a more general model
    • idea is to prevent over-training (i.e. finding patterns where none exist)
  • Test set
    • used to evaluate the model performance

Avoiding Overfitting​

  • stop growing the tree once the test error decreases
  • grow the tree as normal (i.e. wit hoverfitting) then post-prune it.
  • use a separate set of data apart from training to test when to prune nodes (training & cross-validation set)
  • use all data to train, but apply a statistical test whether to expand/prune a node.
  • use an explicit complexity measure (e.g. Minimum Description Length, MDL) to trade off accuracy vs complexity.

Reduced-Error pruning​

  • build tree
  • consider each node in tree for pruning
  • pruning
    • remove subtree
    • make into a leaf
    • assign label as most common class in associated training examples.
  • if pruned tree has as good error on the cross validation set as the unpruned tree, do the prune.
  • keep pruning until the error on cross validation set increases.

Cross validation set​

  • the main difficulty comes when you don't have much data and need it all for training.
  • k-fold cross-validation or leave-one-out training can help.

Rule Post-Pruning​

  • converts the decision tree to rules
  • removes preconditions that do not worsen the accuracy (on the cross validation set or with a statistical test)
  • sorts the rules by estimated accuracy and uses this order when classifying new data

Continuous Valued Variables​

  • use real valued attributes for tests at nodes.
  • Dynamically define new discrete attributes that partition the continuous attribute.
  • discrete: A<v=trueA < v = true and A>=v=falseA >= v = false
  • the boundary poins can be estimated from the training data.

The confusion matrix​

  • a basic method of evaluation of classifiers
  • The columns have numbers associated with the actual number of positive data points in the test set and the actual number of negative data points in the test set
Predicted PositivePredicted Negative
Actual PositiveTrue Positive (TP)False Negative (FN)
Actual NegativeFalse Positive (FP)True Negative (TN)
  • TP: the number of correct prediction of positive samples.
    • the number of data points in the test set that were positive and the classifier correctly assigned them to the positive group
  • TN: the number of correct prediction of negative samples
    • the number of data points in our test set that was actually negative and predicted as negative by the classifiers
  • FP: the number of incorrect predictions of positive samples
    • the value of data points in our test set that was actually negative but were predicted by the classifier as positives.
    • These ones are obvious errors, which is called a type 1 error.
    • type I error
  • FN: the number of incorrect prediction of negative samples.
    • the number of data points in our test set that was actually positive but were predicted by the classifier as negative
    • usually called the type 2 error, and when we are trying to build a classification.
    • might have a trade-off between the number of the type 1 error or the type 2 error.
    • type II error

Vocabulary for AI 008

· 약 3분

Vocabulary & Expressions​

Term/ExpressionDefinitionSimpler ParaphraseMeaning
invariancethe quality of remaining unchanged when something else changesunchangingness불변성
disjunctiona logical operation that outputs true whenever at least one of its inputs is trueor operation논리합, OR
convergencethe process of coming together to a common pointcoming together수렴
impracticallynot in a practical or realistic mannernot practical비현실적으로
receptora cell or group of cells that receives stimuli and transmits them to sensory nervessensor수용체, 감각기
sensationthe process of sensing our environment through touch, taste, sight, sound, and smellfeeling감각
diffusespread out over a large area; not concentratedspread out확산되다
albedothe proportion of the incident light or radiation that is reflected by a surfacereflectivity반사율
color constancythe feature of the human color perception system which ensures that the perceived color of objects remains relatively constant under varying illumination conditionsconsistent color perception색채 항등성
occlusionthe blocking of light or other radiation by an objectblockage폐색, 차폐
deformationthe action or process of changing in shape or distorting, especially through the application of pressuredistortion변형
foreshorteningthe visual effect or optical illusion that causes an object or distance to appear shorter than it actually is because it is angled toward the viewerperspective shortening단축, 단축법
courtesyprovided at no costfree of charge무료 제공
apprenticeship learninga type of learning where an agent learns to perform tasks by observing and imitating a more experienced agentlearning by imitation도제 학습
consolidatemake (something) physically stronger or more solidstrengthen강화하다
aquamarinea light bluish-green colorlight blue-green아쿠아마린
fulvousa dull yellowish-brown colordull yellow-brown황갈색의
verbatimin exactly the same words as were used originallyword for word말 그대로, 축어적으로
lexiconthe vocabulary of a person, language, or branch of knowledgevocabulary어휘집
adherentsomeone who supports a particular party, person, or set of ideassupporter지지자
syntactic consitituenta word or a group of words that function as a single unit within a hierarchical structuresentence unit구문 성분
pragmaticsthe branch of linguistics dealing with language in use and the contexts in which it is usedlanguage use화용론
casea grammatical category that marks the relationship between a noun and other words in a sentencegrammatical role격
persona grammatical category that distinguishes between different participants in a conversation (e.g., first person, second person, third person)participant distinction인칭
numbera grammatical category that expresses count distinctions (e.g., singular, plural)count distinction수
headthe main word in a phrase that determines its syntactic typemain word중심어
separabilitythe quality of being able to be separated or divideddivisibility분리 가능성
intrinsicbelonging naturally; essentialinherent본질적인
기법아이디어비유
Laplace (Add-One)모든 경우의 수에 +1을 더해줌. 안 본 것도 최소한의 기회를 줌.시험 점수를 0점 맞아도 최소 1점은 줘
Backoffn-gram이 없으면 더 짧은 n-gram으로 내려가서 확률을 씀.3단어 조합 못 봤네? → 그럼 2단어 조합으로 보자 → 그것도 없으면 1단어라도 보자.
Linear Interpolation여러 레벨(n=1,2,3)을 동시에 섞어서 확률 계산.국어, 영어, 수학 점수를 일정 비율(λ)로 합쳐서 성적 보는 것.
Witten-Bell / Kneser-Ney더 정교하게 확률 질량을 재분배. (현업에서 성능 좋음)선생님이 본 적 없는 문제지만 유사 문제를 잘 풀었으니 점수 좀 더 주자 하는 것.
Stupid Backoff대충 큰 코퍼스를 모아서, 그냥 단순 backoff만 사용. (빅데이터 시대 구글에서 씀)데이터가 워낙 많으니까, 그냥 단순한 방법도 잘 먹힌다.

IAI +006

· 약 8분

Markov process or Markov chain​

the state sequence satisfies the Markov assumption

  • The current state depends on only a finite fixed number of previous states.
  • P(Xt∣X0:t−1)=P(Xt∣Xt−1)P(X_t | X_{0:t-1}) = P(X_t | X_{t-1})

Decision Theory​

  • Choosing actions based on the desirability of their immediate outcomes.
  • The outcome of taking action aa in state s0s_0 is deterministic then Result(s0,a)Result(s_0, a).
  • If the outcome is non-deterministic (stochastic), fully observable, the agent knows the current state s0s_0.
    • It is represented as a random variable whose values are the possible outcome states.
    • The transition model specifies the probabilities of possbile outcome states.
    • P(s,a,s′)P(s, a, s')

MEU, Maximum Expected Utility​

A rational agent should choose the action that maximizes its expcted utility.

  • The MEU principle could be seen as defining all of AI.
  • action=argmaxa(EU(a∣e))action = argmax_a(EU(a|e))
    • among this set of actions, give the highest expected utility.
  • EU(a∣e)=∑s′(P(Result(a)=s′∣a,e)∗U(s′))EU(a|e) = \sum_{s'} (P(Result(a) = s' | a, e) * U(s'))

Sequential decision problem​

type of problem or scenario where a decision-maker must make a series of choices or decisions over time in order to achieve a desired outcome.

  • a sequential decision-making problem or sequential decision-making task

MDP, Markov Decision Process​

a sequential decision problem for a fully observable, stochastic environment environment with a Markovian transition model and additive rewards.

  • a formal framework for modeling sequential decision problems.
  • including states, actions, transition probabilities, and rewards
  • used in reinforcement learning and operations research.
ComponentDescription
Environmentfully observable, Stochastic
Statesa set of states (with an initial state S₀)
Transition modelMarkovian
Rewardadditive
AgentMake decisions at time step for actions
Interacts with environment through percepts and actions
  • A set of states: an initial state S0S_0, possible terminal state(s)
  • A set of actions in each state: ACTIONS(s)ACTIONS(s)
  • A stochastic Markov transition model: P(s′∣s,a)P(s' | s, a)
  • A reward function: R(s)R(s) or R(s,a,s′)R(s, a, s')
  • In MDP, Additive Reward is defined as a function that assigns a numerical value to each state-action pair or state-transition pair.
    • represents the immediate benefit or cost associated with taking a specific action in a particular state.
  • The solution must specify what the agent should do for any state that the agent might reach.
  • Policy: π(s)π(s), an action for each state
    • A solution to an MDP.
    • π(s)\pi(s) is the action recommended by the policy π\pi for state ss
  • Q state: Q(s,a)Q(s, a), the expected utility of doing action aa in state ss

RL, Reinforcement Learning​

  • an agent interacts with an environment
  • takes actions to maximize a cumulative reward signal over time.
  • learns a policy that balances exploration and exploitation
    • exploration: trying new actions.
    • exploitation: choosing known good actions.

Sample MDP​

Environment​

  • The agent lives in a 4x3 fully observable stochastic environment
  • Walls block the agent's path; Begin in the start state, the agent must choose an action at each time step
  • Actions available to the agent in each state: Up, Down, Left, or Right
  • The interaction with the environment terminates when the agent reaches one of the goal states, marked +1 or -1

4x3 Grid World​

1234
3+1
2🚫-1
1START
  • START: Initial position (1,1)
  • 🚫: Wall (impassable)
  • +1: Goal state with positive reward
  • -1: Goal state with negative reward

Transition Model​

  • Stochastic environment with uncertainty
  • When agent chooses an action, there's:
    • 0.8 probability of moving in intended direction
    • 0.1 probability of moving perpendicular to intended direction (each side)

Reward Function​

  • The agent receives rewards each time step:
    • Small "living" reward each step (-0.04 in all states except the terminal states)
    • Big rewards come at the end (+1 for good and -1 for bad terminal states)

Goal​

  • To maximize sum of rewards from the start state to a terminate state

Additive Reward​

  • a type of reward structure
  • the total reward earned by an agent in an MDP
  • calculated by summing up the individual rewards received at each time step as the agent interacts with the environment.

Discounted reward​

  • a techinque used to calcluate the expected cumulative reward over time.
  • applying a discount factor to future rewards, prioritizing more immediate rewards over distant ones.

Utility​

Uπ(s)=E[∑t=0∞γtR(St,π(St),St+1)]U^{\pi}(s) = E\left[\sum_{t=0}^{\infty} \gamma^t R(S_t, \pi(S_t), S_{t+1})\right]

  • The expectation EE is with repect to the probability distribution over state sequences determined by ss and π\pi.
  • γ\gamma is the discount factor, 0≤γ<10 \leq \gamma < 1, which determines the present value of future rewards.
  • R(St,π(St),St+1)R(S_t, \pi(S_t), S_{t+1}) is the reward received when transitioning from state StS_t to state St+1S_{t+1} by taking action π(St)\pi(S_t).

Bellman equation​

U(s)=maxa∈A(s)∑s′P[s′∣s,a](R(s,a,s′)+γU(s′))U(s) = max_{a \in A(s)} \sum_{s'}P[s'|s,a](R(s,a,s') + \gamma U(s'))

Formula ComponentDescription
U(s)U(s)the utility of state ss
maxamax_athe maximum over all possible actions a∈ACTIONS(s)a \in ACTIONS(s)
∑s′\sum_{s'}the sum over all possible successor states s′s'
P[s′∣s,a]P[s'\vert s,a]the transition probability of reaching state s′s'
R(s,a,s′)R(s,a,s')the reward received after transitioning from state ss to state s′s' by taking action aa
γ\gammathe discount factor, 0≤γ<10 \leq \gamma < 1
U(s′)U(s')the utility of the successor state s′s'
  • In optimal setting, the neighbor state meets the Bellman equation.
  • From s0s_0 to termination, each step in the sequence should match the Bellman equation.

πs∗=argmaxπUπ(s)\pi^{*}_s = argmax_{\pi}U^{\pi}(s)

Q function​

  • the expected utility of taking a given action in a given state.
  • enables the agent to act optimally simply by choosing
    • U(s)=maxaQ(s,a)U(s) = max_a Q(s,a)
  • The optimal policy can be extracted from the Q-function.
    • π∗(s)=argmaxaQ(s,a)\pi^{*}(s) = argmax_a Q(s,a)

Q(s,a)=∑s′P[s′∣s,a](R(s,a,s′)+γU(s′)) =∑s′P[s′∣s,a](R(s,a,s′)+γmaxa′Q(s′,a′))Q(s,a) = \sum_{s'}P[s'|s,a](R(s,a,s') + \gamma U(s')) \\ \space = \sum_{s'}P[s'|s,a](R(s,a,s') + \gamma max_{a'}Q(s',a'))

Reinforcement Learning​

Key components of RL​

  • Agent
  • Environment
  • State
  • Action
  • Reward
  • Policy

Application of RL​

  • Robotics
  • Autonomous systems
  • Game playing
    • Atari video games from raw visual input
    • Playing poker
    • Alpha Go
  • Recommendation systems

RL Algorithms​

  • Model-based RL
    • often learns a utility function U(s)U(s)
    • the sum of rewards from state ss onward from observing the effects of its actions on the environment.
  • Model-free RL
    • Action-utility learning, such as Q-learning
    • Policy learning
  • Passive RL
    • the agent's policy is fixed
    • the task is to learn the utilities of states.
  • Active RL
    • the agent must figure out what to do through exploration and exploitation.
      • Exploration: trying new actions to discover their effects.
      • Exploitation: leveraging known actions that yield high rewards.

Direct Utility Estimation​

  • the utility of a state is the expected total reward from the state onward.
    • the expecgted reward-to-go from that state.
    • each trial provides a sample of this quantity for state visited.
  • end of each sequence, the algorighm calculates the observed reward-to-go for each state and updates the estimated utility for the state accordingly.
  • In the limit of infinitly many trials, the sample average will converge to the expectation in teh Bellman equation.
  • Ignores the connections between states.
    • misses opportunities to learning, it learns nothing until the end of the trial.
    • often converges very slowly.

Adaptive Dynamic Programming, ADP​

Ui(s)=∑s′P(s′∣s,πi(s))[R(s,πi(s),s′)+γUi(s′)]U_i(s) = \sum_{s'}P(s'|s,\pi_{i}(s))[R(s,\pi_{i}(s),s') + \gamma U_{i}(s')]

  • advantage of the constraints among the utilities of states by learning the transition model
    • that connects them and solves the corresponding MDP
    • using dynamic programming to calculate the utilities of the states.
  • These Bellman equations are linear when the policy πi\pi_i is fixed
    • can be solved using any linear algebra package.

Learning a transition model​

  • the environment is fully observable
  • the agent can learn the mapping from a state-action pair (s,a)(s, a) to the resulting state s′s'.
  • The transition model P(s′∣s,a)P(s'|s,a) is represented as a table and it is estimated directly from the counts that are accumulated in Ns′∣s,aN_{s'|s,a}.
  • The counts record how often state s′s' is reached when executing aa in ss.
    • P(s′∣s,a)=Ns′∣s,a∑s′′Ns′′∣s,aP(s'|s,a) = \frac{N_{s'|s,a}}{\sum_{s''}N_{s''|s,a}}

Temporal difference, TD​

Uπ(s)←Uπ(s)+α[R(s,π(s),s′)+γUπ(s′)−Uπ(s)]U^{\pi}(s) \leftarrow U^{\pi}(s) + \alpha[R(s,\pi(s),s') + \gamma U^{\pi}(s') - U^{\pi}(s)]

  • when a transition occurs from state ss to state s′s' via action π(s)\pi(s)
  • α\alpha is the learning rate, 0<α≤10 < \alpha \leq 1
  • no need a transition model to perform updates
  • the environment is itself supplies the connection between neighboring states in the form of observed transitions.

Q learning​

  • model-free reinforcement learning algorithm
  • the agent learns a Q-function, Q(s,a)Q(s,a)
  • avoids the need for a model by learning an action-utility function Q(s,a)Q(s,a) instead of utility function U(s)U(s).
  • a model-free Q-learning TD update
    • Q(s,a)←Q(s,a)+α[R(s,a,s′)+γmaxa′Q(s′,a′)−Q(s,a)]Q(s,a) \leftarrow Q(s,a) + \alpha[R(s,a,s') + \gamma max_{a'}Q(s',a') - Q(s,a)]
    • this update is calculated whenever action aa is executed in state ss leading to state s′s'
  • TD Q-learning agent doesn't need a transition model P(s′∣s,a)P(s'|s,a)
    • either for learning or for action selection.

Research methodology

· 약 1분

Quantitative and Qualitative Methods​

CategorySub CategoryQuantitativeQualitative
RequirementQuestionHypothesisInterest
MethodControl and randomizationCuriosity and reflexivity
Data collectionResponseViewpoint
OutcomeDependent variableAccounts
IdealDataNumericalTextual
Sample sizeLarge (power)Small (saturation)
ContextEliminatedHighlighted
AnalysisRejection on nullSynthesis

Types of Research Methodology​

  • Historical: Qualitative
  • Comparative: Qualitative
  • Descriptive: Qualitative
  • Correlation: Quantitative
  • Experimental: Quantitative
  • Evaluation: Qualitative
  • Action: Qualitative
  • Ethnographic: Various (not quantitative)
  • Ethnogenic: Various (not quantitative)
  • Feminist/Identity Politics: Various (not quantitative)
  • Cultural: Various (not quantitative)

Common data collection methods​

Qualitative data collection methods​

  • Observations: recording what you have seen, heard, or encountered in detailed field notes
  • Interviews: asking people questions in one-on-one conversations
  • Focus groups: asking questions and generating discussion among a group of people
  • Surveys: distributing questionnaires with open-ended questions
  • Secondary research: collecting existing data in the form of texts, images, audio or video recordings, etc.

Quantitative data collection methods​

  • Experiments
  • Computer Simulation and Agent-Based Models
  • Controlled observations
  • Surveys: paper, kiosk, mobile, questionnaires
  • Longitudinal studies
  • Polls and Telephone interviews
  • Face-to-face interviews

FDA +006

· 약 9분

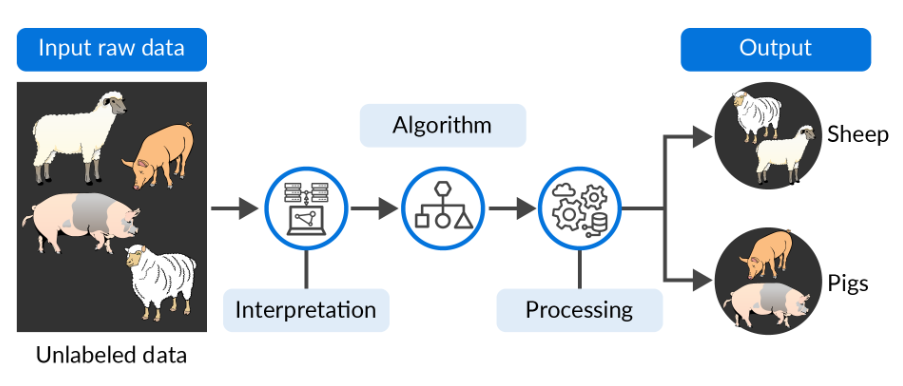
Unsupervised machine learning​

ItemSupervised machine learningUnsupervised machine learning
Data availabilityInput and output variables will be given.Only the input data will be given.
LabelingAlgorithms are trained using labelled data.Algorithms are used against data which is not labelled.
AlgorithmsSupport Vector Machine, Linear and Logistic Regression and Classification Trees.Cluster algorithms, K-means, Hierarchical clustering, etc.
Complexitysimpler method.computationally complex.
Learning modeThe learning method takes place offline.The learning method takes place in real-time.
Reliabilityhighly accurate and trustworthy method.less accurate and less trustworthy method.

Processing data

  • most common tasks are clustering, anomaly detection, and neural networks.
  • infer underlying patterns without human supervision or intervention and enable us to discover both the differences and similarities in a dataset.
  • can be considered ideal solutions for exploratory data mining.

Clustering​

objects (unlabelled data) are organised into groups, where the members of each group are similar in some way to each other and less similar to those in other groups.

  • Classification assigns objects/data to the predefined (labelled) classes
  • Clustering groups the objects/data based on the similarities between them
  • used in pattern recognition, image analysis and bioinformatics.
  • different clustering algorithms can produce different results based on their own definition of a cluster
  • the parameters (such as the distance function, density threshold and the number of expected clusters) of the clustering algorithm should be set based on the particular characteristics of the dataset and the user’s intention
DomainUse cases
Biology and bioinformaticsCluster algorithms have been used in biological systematics for comparing the genus differences in organisms.
MedicineCluster analysis can be used to detect underlying factors of particular diseases, such as coronary artery disease. It is also used to describe patterns of antibiotic resistance.
Market basketCluster analysis has gained increasing popularity in market research. It can be used to classify different groups of consumers by behaviour analysis. It helps to build a better understanding of market segmentation, pricing and new product testing.
Computer scienceClustering is a powerful tool for various tasks in the area of computer science, such as reforming functionality in software evolution, object recognition in computer vision and lexical ambiguity in natural language process.
Car insuranceIdentify customer groups with high average claim costs.
  • Similarity Measure: Numerical measure of how alike two data objects often fall between 0 (no similarity) and 1 (complete similarity)
  • Dissimilarity, or Distance Measure: Numerical measure of how different two data objects are range from 0 (objects are alike) to ∞\infty (objects are different)
  • Proximity: Refers to a similarity or dissimilarity

Distance measures​

Distance metrics or dissimilarity measures

  • basically deal with finding the proximity or distance between data points and determining if they can be clustered together.
  • Manhattan distance: distance between two vectors if they could only move right angles.
    • Dist(A,B)=∑∣ai−bi∣Dist(A, B) = \sum_{} |a_{i} - b_{i}|
    • no diagonal movement involved in calculating the distance.
  • Euclidean distance: can best be explained as the length of a segment connecting two points.
    • Dist(A,B)=∑(ai−bi)2Dist(A, B) = \sqrt{\sum_{} (a_{i} - b_{i})^{2}}
    • calculated from the cartesian coordinates of the points using the Pythagorean theorem.
    • Typically, one needs to normalize the data before using this distance measure.
    • the dimensionality increases of your data, the less useful Euclidean distance becomes
  • Cosine similarity: the cosine of the angle between two vectors.
    • Dist(A,B)=∑(xi⋅yi)∑xi2⋅∑yi2Dist(A, B) = \frac{\sum_{} (x_i \cdot y_i)}{\sqrt{\sum_{} x_i^2 \cdot \sum_{} y_i^2}}
    • a way to counteract Euclidean distance’s problem with high dimensionality.
    • has the same inner product of the vectors if they were normalized to both have length one
    • The magnitude of vectors is not taken into account, merely their direction.
      • In practice, this means that the differences in values are not fully taken into account.
  • Single link: the shortest distance between points
  • Complete link: the largest distance between points.
  • Average link: average distance between points.
  • Centroid: the distance between centroids.

Weighted distance measures​

Dist(A,B)=∑wi(ai−bi)2Dist(A, B) = \sqrt{\sum_{} w_i (a_{i} - b_{i})^{2}}

  • a weight to the attributes as some attributes are more important than others.
  • force clustering to pay more attention to higher weight attributes and form clusters that depend more on those heavily weighted attributes.

Dissimilarity​

  • Simple matching coefficient, SMC: invariant, if the binary variable is symmetric.
    • d(i,j)=b+ca+b+c+dd(i,j) = \frac{b+c}{a+b+c+d}
      • the proportion of mismatches (b+c) out of all attributes (a+b+c+d).
    • The simple matching coefficient is used when 0 and 1 are equally important, treating matches of both 1s and 0s the same way.
  • Jaccard coefficient: non-invariant, if the binary variable is asymmetric.
    • d(i,j)=b+ca+b+cd(i,j) = \frac{b+c}{a+b+c}
      • ignores cases where both are 0 (d), and only considers mismatches relative to at least one positive case.
    • The Jaccard coefficient is used when 1 (presence) is more meaningful than 0 (absence).

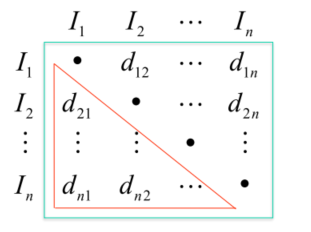
Similarity Matrix​

  • After calculating all distances, we can create a similarity matrix
  • containing the distance between each pair of data points.

Similarity matrix

IDGenderAgeSalary
1M4545000
2F3254000
3F2332000
4M3658000
  • Gender: binarized
  • Age: normalized
  • Salary: normalized
IDGenderAgeSalary
1110.25
200.60.7
3000
410.70.8
  • dist(ID2,ID3)=(0−0)2+(0.6−0)2+(0.7−0)2=0.92dist(ID2, ID3) = \sqrt{(0-0)^2 + (0.6-0)^2 + (0.7-0)^2} = 0.92
  • dist(ID2,ID4)=(0−1)2+(0.6−0.7)2+(0.7−0.8)2=1.02dist(ID2, ID4) = \sqrt{(0-1)^2 + (0.6-0.7)^2 + (0.7-0.8)^2} = 1.02

Clustring methodologies​

  • Hierarchical approach: create trees of clusters and sub-clusters
    • Divisive (Top-down): Start with all examples in a single cluster, and decide how to break the cluster into multiple sub-clusters.
    • Agglomerative (Bottom-up): Start with each example in its own separate cluster. Decide which clusters to merge.
  • Partitional (K starting points): Start with KK random cluster centers, and decide which examples to put in each of the clusters.
    • Adjust the cluster centers after each allocation of examples to clusters.
    • k-means, k-medoids

Choosing a clustering method​

ConsiderationWhat to look forTypical choices
ScalabilityNear-linear time and bounded memory on large datasets.MiniBatch K-Means, BIRCH, scalable DBSCAN with indexing.
Arbitrary shapesAbility to find non-spherical clusters.DBSCAN, HDBSCAN, Spectral clustering.
Noise and outliersRobustness to noise; ability to mark points as noise.DBSCAN, HDBSCAN (labels noise), GMM with low-weight components.
Mixed attribute typesWorks with categorical + numeric or custom distances.k-prototypes/k-modes, Agglomerative with Gower distance.
Few parametersMinimal, intuitive hyperparameters; stable defaults.Agglomerative (linkage, distance), HDBSCAN (min cluster size).
Order insensitivityResults independent of input order.Most batch methods; shuffle for MiniBatch K-Means.
High dimensionalityHandles curse of dimensionality or uses reduction.PCA + K-Means/Agglomerative, Spectral after reduction, cosine distance.
User constraintsMust-link/cannot-link or size constraints supported.COP-K-Means, constrained agglomerative, semi-supervised variants.
InterpretabilityEasy to explain clusters and decisions.K-Means centroids, Agglomerative dendrograms, GMM probabilities.

Clustering Terminology​

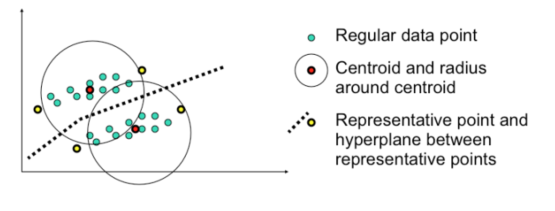
Clustering Points

  • Centroid: a point in the middle of a cluster. It may not be an actual point in the dataset.
  • Medoid: an actual point in the dataset that is centrally located and is, therefore, representative of the cluster.
  • Representative points: are points around the cluster that are representative of the cluster.
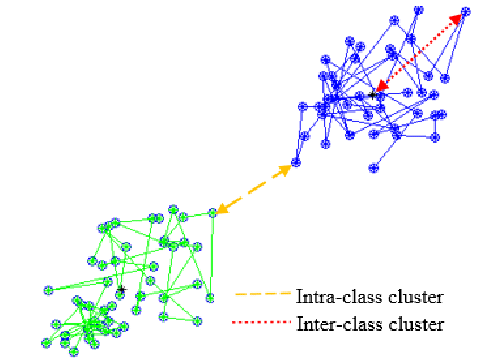
  • High intra-class similarity: the homogeneity, the closeness of data points within a single cluster
  • Low inter-class similarity: The distance between two separate clusters

Class in Cluster

  • A good clustering method will produce high-quality clusters with high intra-class similarity and low inter-class similarity.

Hierarchical clustering​

  • Hierarchical approaches lead to the formation of dendrograms
  • The top and bottom of a dendrogram represent the two extremes of clustering
    • At the bottom, a leaf is an individual cluste
    • At the top, the root is one cluster

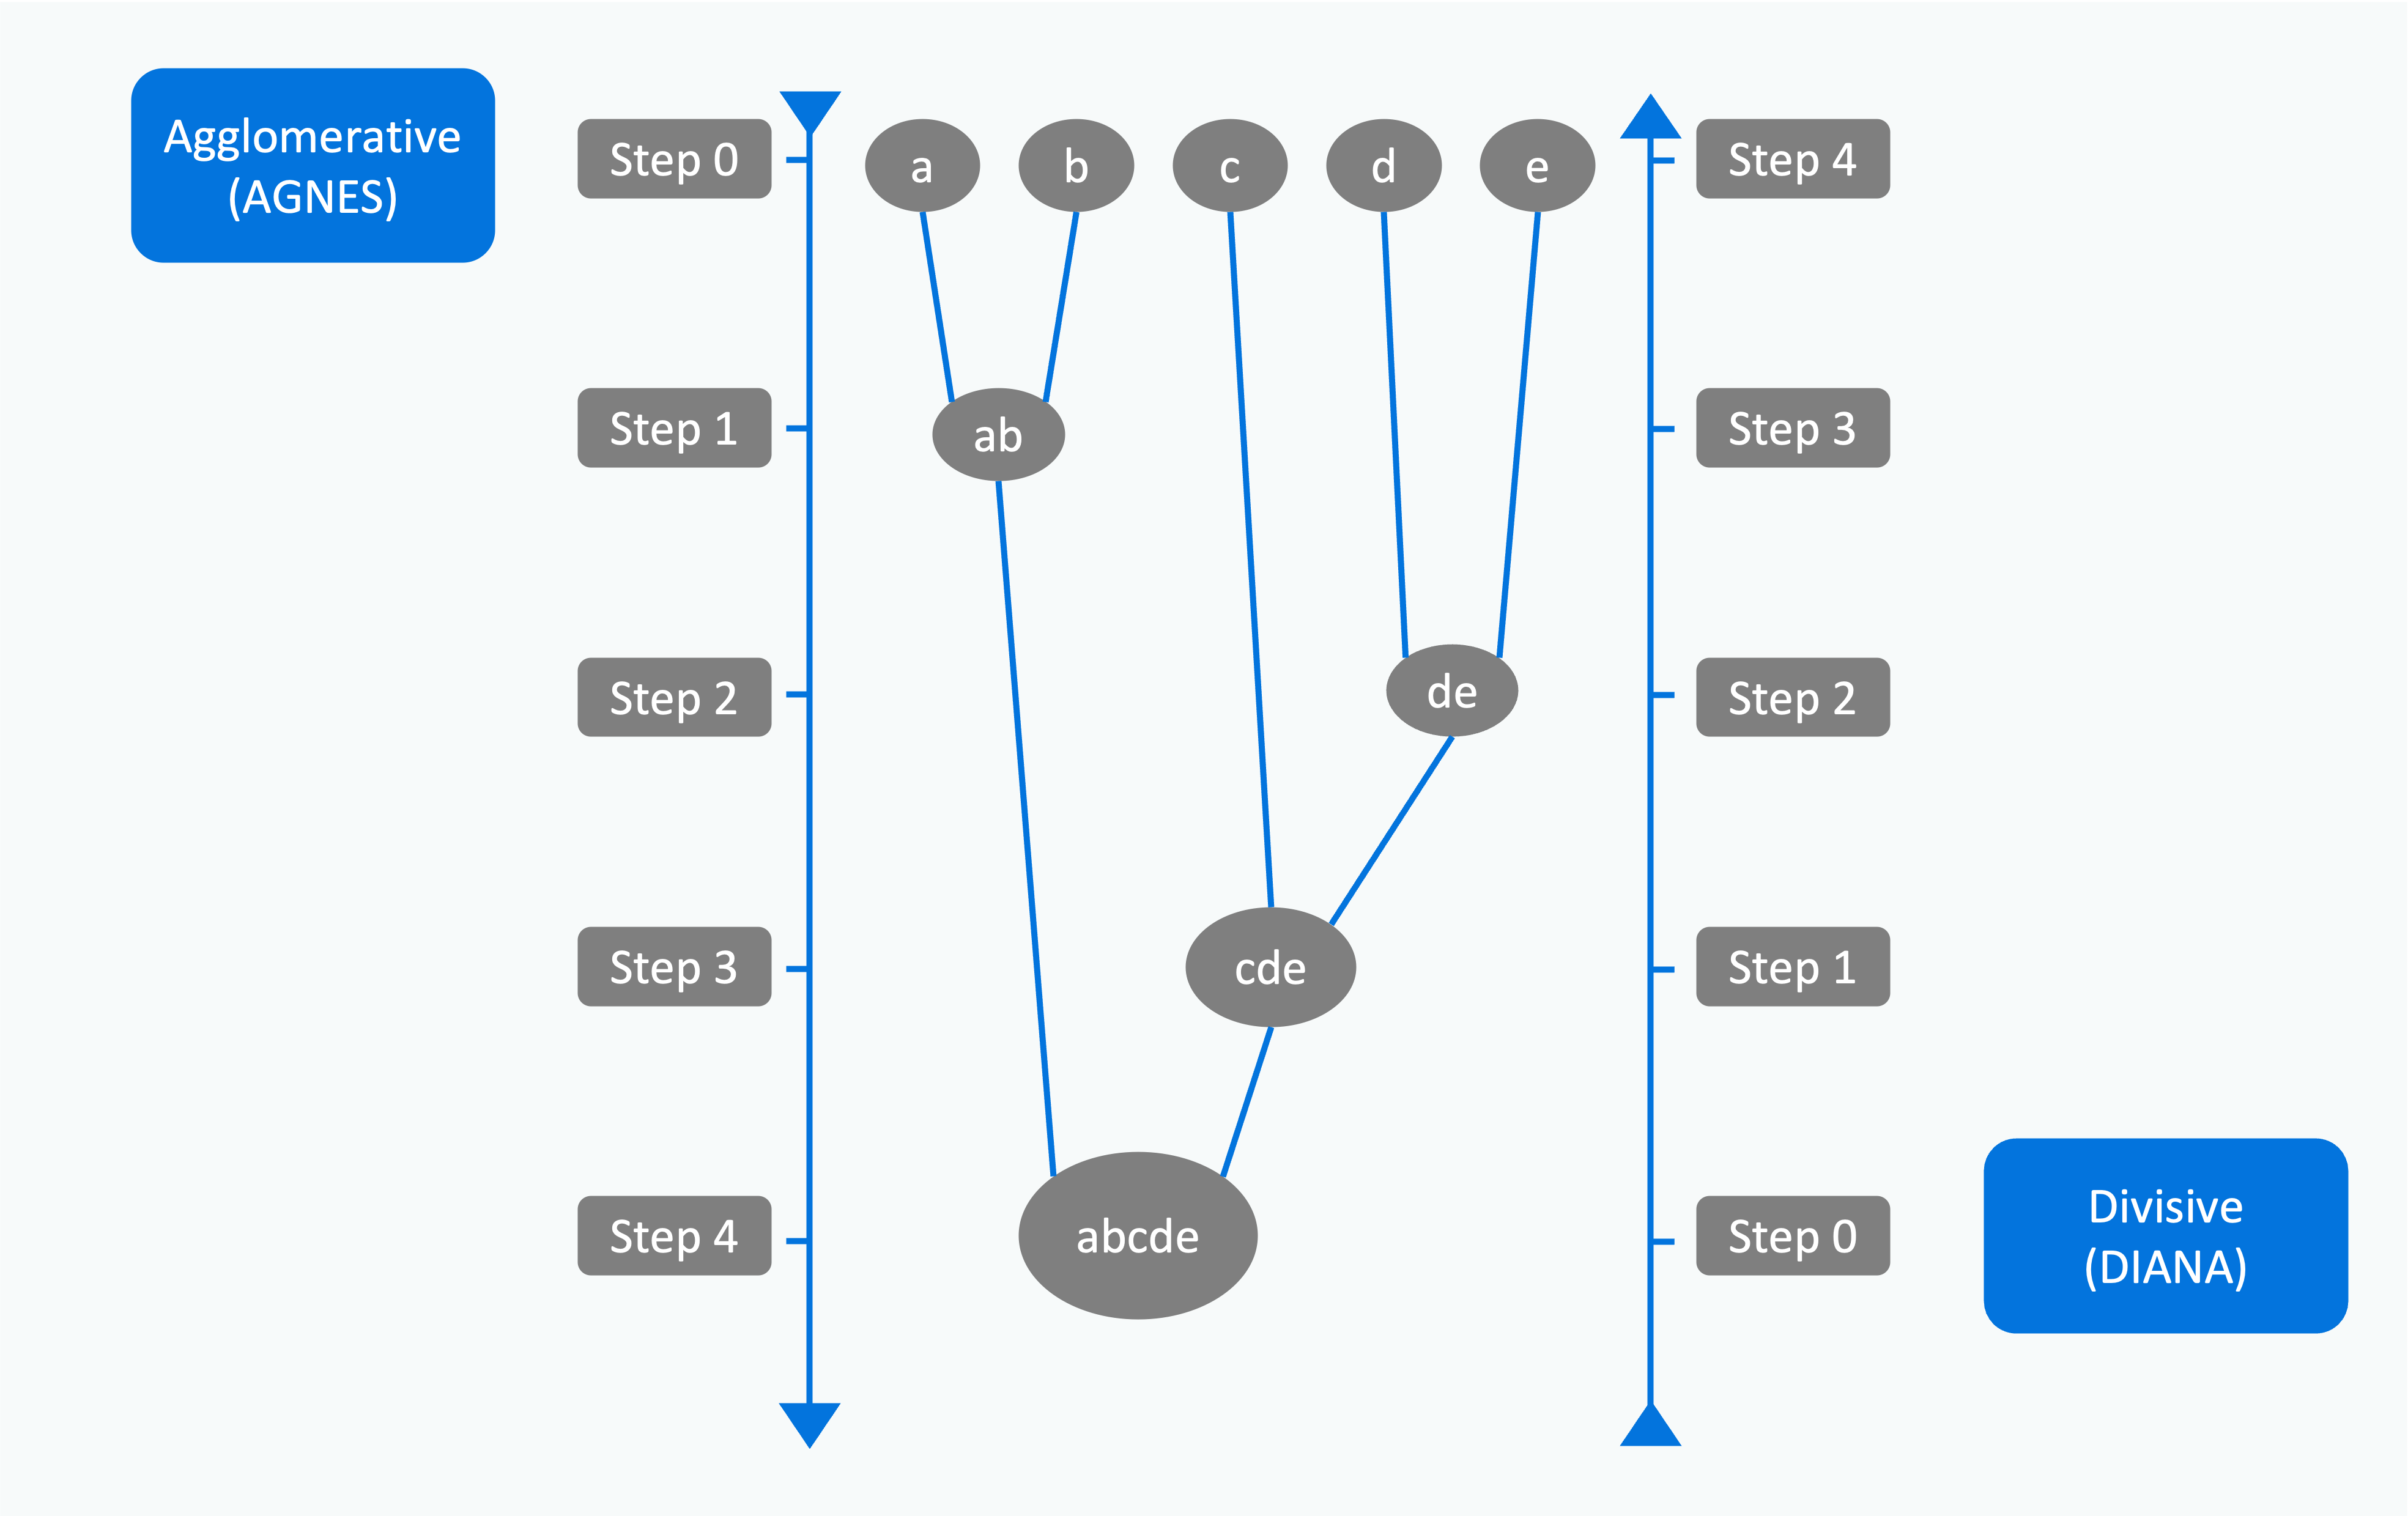
AGNES​

AGgglomerative NESting hierarchical clustering algorithm.

  • Agglomerative hierarchical clustering follows a bottom-up approach
    • starting with clusters of single objects and merging them into bigger and bigger clusters
  • agglomerative clustering process terminates (or finishes) when a termination condition is satisfied or there is only one cluster containing all objects.
  • based on Euclidean distance between two objects
  • steps of the algorithm:
    1. Make a cluster with only one object as member for all objects
    2. Calculate the Euclidean distance between each pair of clusters
    3. Choose the cluster pair with the smallest distance and merge them to make one cluster
    4. Repeat step 2 with the new combined cluster and the other, older clusters
    5. Repeat steps 3 and 4 until all the objects are merged into a single cluster.

DIANA​

DIvisive ANAlysis clustering algorithm.

  • The top-to-bottom approach is followed in divisive hierarchical clustering
    • starts with a cluster containing all objects.
  • This cluster is broken up into smaller clusters, and this process of breaking up clusters continues until each cluster contains one object or a given termination condition is satisfied.
  • steps of the algorithm:
    1. The process of starts at the root with all the points as one cluster.
    2. It recursively splits higher-level clusters to build the dendrogram.
    3. It can be considered as a global approach.
    4. It is more efficient when compared with agglomerative clustering.

Agenes vs Diana

Single-linkage clustering​

the minimum method, connectedness, or nearest neighbour method

  • two clusters are linked by a single element pair
  • The distance between clusters is defined as the shortest distance from a member of the first cluster to a member of the second cluster.

Complete-linkage clustering​

the furthest neighbour method, maximum method, or diameter method.

  • the distance between two clusters is defined as the greatest distance between any member of the first cluster and any member of second cluster

Average-linkage clustering​

the minimum variance method

  • the distance between two clusters is calculated by averaging the distance between each member of first cluster and each member of second cluster

FDA +005

· 약 3분

Data visualization​

  • Successful visualization requires data be converted into a visual format.
  • Motivation is to play to the strengths of people
    • for people to quickly absorb a large mount of informatin and find patterns in it.

Data visualization process​

  • a human who looks at the visual and perceives information.
  • the human should be able to answer some questions by looking at the visual after perception.
ItemExploratoryExplanatory
PurposeTo analyse data to solve a question or develop a hypothesis.To convey a message or idea.
Target audienceExpert users with prior knowledge of the subject.Non-expert users with limited or no background knowledge.
WhenUsually happens during the data analytics project and is internal facing.Usually happens after the exploration phase and is often external facing.
ApproachUnguided, users explore, with no clear conclusion.Guided through author-chosen comparisons, clear conclusions.
RepresentationHas an analytical purpose and represents the complexity of data.No analytical purpose and represents understandable data.

Descirptive statistics​

  • Describe some data through a quantitative summarisation of its behaviour
  • Help us summarise data in a meaningful way.
  • Highlight things like whether there are any values that are ill defined, or which make no sense.
  • measures of central tendency
    • mean
    • median
    • mode
  • measures of spread
    • range
    • variance
    • standard deviation
    • interquartile range

Inferential statistics​

  • includes more advanced methods such as hypothesis tests, ANOVA, and regression.
  • make claims about how general this dataset is.
  • we can make inferences from a sample to a population.

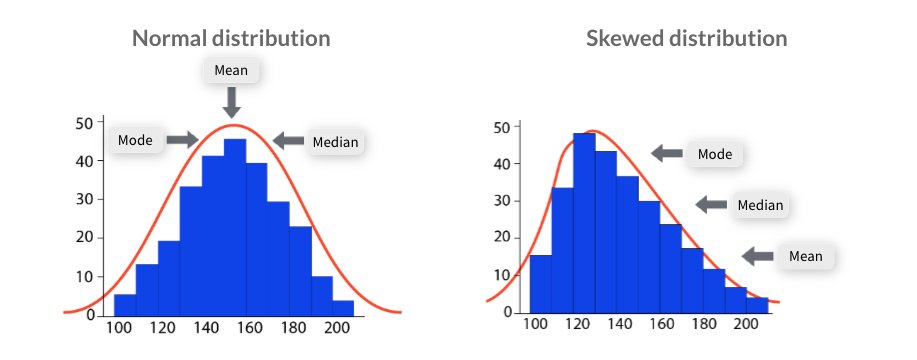
Measures of central tendency​

  • a quick and easy way to describe a dataset by condensing it down to just one representative value.
  • can easily compare one dataset to another.
  • Mean: the averge of a dataset.
  • Median: the middle value in a dataset.
  • Mode: the most commonly occurring value in a dataset.

Distribution

Measures of spread​

  • how similar or varied a set of values are for a particular variable
  • summarise the data in a more detailed way that shows how scattered the values are and how much they differ from the central tendency.
  • Range: the largest value of a variable and subtracts the smallest.
    • The bigger the range the more spread out a data set is.
  • Variance: how far a set of numbers are spread out from their average value.
  • Standard deviation: the square root of the variance
    • gives us back a value that has the same units as the mean
  • Interquarile range, IQR: the difference between the upper and lower medians.
    • First, find the median of a set of data.
    • Then, find the medians of the upper and lower half of the data.

Frequency distribution​

  • Frequency is the number of times a data value occurs or repeats.
  • frequency(vi)=number of objects with attribute value vimfrequency(v_i) = \frac{\text{number of objects with attribute value}\thinspace v_i}{m}
  • Visual displays that organise and present frequency counts so that the information can be interpreted more easily.
  • can show absolute frequencies or relative frequencies, such as proportions or percentages.
  • can be shown in a table or graph.
  • Some common methods of showing frequency distributions include frequency tables, histograms or bar charts.
  • Frequency tables: display the number of occurrences of a particular value or characteristic.
  • Histograms: a type of graph in which each column represents a numeric variable
    • useful for describing the shape, centre and spread to better understand the distribution of the dataset.
  • Bar charts: a type of graph in which each column represents a categorical variable or a discrete ungrouped numeric variable.

Vocabulary for AI +007

· 약 3분

Vocabulary & Expressions​

Term/ExpressionDefinitionSimpler ParaphraseMeaning
refereeA person who supervises a game or match to ensure the rules are followedUmpire심판
nonterminal stateThe agent is still in the middle of the episode. The environment can continue to produce rewards, and the agent can still take actions.ongoing state비종결 상태
apprenticeshipa period of time working as an apprenticeinternship수습 기간
in a similar veinin a similar waysimilarly비슷한 맥락에서
subsequentcoming after something in time; followingfollowing그 다음의
in the sensein the most limited meaning of a word, phrase, etc.in the meaning~라는 의미에서
hypothesisa supposition or proposed explanation made on the basis of limited evidence as a starting point for further investigationassumption가설
untimelyhappening or done at an unsuitable timeill-timed때 아닌, 시기상조의
utilitythe state of being useful, profitable, or beneficialusefulness효용
thereafterafter that timeafter that그 후에
analogya comparison between two things, typically for the purpose of explanation or clarificationcomparison유추, 비유
inherentexisting in something as a permanent, essential, or characteristic attributeintrinsic내재하는, 타고난

RL​

항목Policy evaluationPassive learningPolicy search
정책 (π)고정, 외부에서 주어짐고정, 외부에서 주어짐없음 → 직접 탐색·개선
환경 모델 (P, R)모두 알고 있음 (완전한 MDP)모름, 경험으로 추정알 수도 있고 모를 수도 있음
학습 목표주어진 정책 하에서 Uπ(s)U^\pi(s) 계산주어진 정책 하에서 Uπ(s)U^\pi(s) 경험 기반 추정최적 정책 π∗\pi^*를 직접 찾기
접근 방식벨만 방정식 기반 반복 계산 (iterative policy evaluation)환경을 실제로 탐험하면서 transition & reward 관찰, 그로부터 utility 추정정책 파라미터를 조금씩 바꾸며 return 극대화 (policy gradient, evolutionary search 등)
필요 데이터없음 (모델이 다 주어짐)환경 경험 (trajectory, reward sequence)환경 경험 (보상 피드백), 때로는 gradient
계산/학습 특징계산 문제, 오차 없이 수렴 가능샘플 효율 낮음, Monte Carlo/TD 방식 사용gradient variance 큼, local optimum 위험
적용 예시교재의 Gridworld (모델식 다 알려진 경우)환경은 블랙박스, 정책 고정 실험 (시뮬레이션 따라다니기)로봇 제어, 연속 행동 공간 (PPO, REINFORCE 등)
장점정확·빠름, 모델만 있으면 해석 용이모델이 없어도 가능, 실제 환경에서 학습연속·복잡한 행동 직접 최적화 가능
단점현실 환경은 모델을 모르는 경우가 많음정책을 개선할 수는 없음 (평가 전용)학습 불안정, 많은 데이터 필요

R(St,π(St),St+1)R(S_t,π(S_t),S_{t+1})

시간 tt에 상태 StS_t에 있었고, 정책이 정한 행동 π(St)π(S_t)을 했더니, 다음 상태 St+1S_{t+1}에 도착했다. 그때 받는 보상은 R(St,π(St),St+1)R(S_t,π(S_t),S_{t+1})이다.

  • 현재 상태에서 정책이 정한 행동을 취해 다음 상태로 갔을 때 받은 보상
  • StS_t: 시간 tt에 에이전트가 위치한 현재 상태
  • π(St)π(S_t): 정책 π가 현재 상태 StS_t에서 선택한 행동 (action)
  • St+1S_{t+1}: 그 행동을 수행한 뒤 도달한 다음 상태
  • RR: 이 세 가지 (현재 상태, 행동, 다음 상태)에 의해 결정되는 보상 함수

Passive RL​

  • Direct Utility Estimation
  • ADP (Adaptive Dynamic Programming)
  • TD (Temporal Difference Learning)

FSD +007

· 약 3분

Collection​

a data sturcucture that groups multiple elemtns togehter logically.

  • referenced by the collection name, and its elements are accessed using indexing or look up methods.
  • some collections allow dynamic sizing, expanding and shrinking with the data, others have a fixed size.
  • can store mixed data types.
    • Java collections are typically type-safe using generics.
    • Python uses dynamic typing.

Python List​

mylist = ["Tom", 30, 112.5]
len(mylist)
mylist[index]
mylist.append(item)
mylist.insert(index, item)
# returns a slice of a list from first to last-1
mylist[first:last]
mylist.index(item)

# replaces items from first to last-1 with a list
mylist[first:last] = [list-values]
# adds list 2 at the end of list 1
mylist = list1 + list2
# adds list 2 at the end of list 1
list1.extend(list2)

mylist.remove(item)
mylist.pop(index)
mylist.pop()
del mylist[index]
del mylist
mylist.clear()

# Sorts the list alphanumerically, ascending
mylist.sort()
mylist.sort(reverse =True)
mylist.reverse()
mylist.count()

Python Set​

  • unordered, not indexed.
  • mutable, unique.
myset = { 'hello', 5, True, 3.5 }

for x in myset:
print(x)

myset.add(item)
# Merges myset iwth the otherset, rtaining unique values
myset.update(otherset)
# Adds other set items to a set (only unique items are retained)
mynewset = myset.union(otherset)
# Retain only the items that exists into set1 and set2
myset = set1.intersection(set2)

# report error if item not found
myset.remove(item)
myset.discard(item)

myset.pop()
myset.clear()
del myset

Python Tuple​

  • a cllection of items of any type
  • ordered, indexed
  • unchangable, once a tuple is created the elemets are fixed
mytuple = ("Tom", 30, 112.5)
len(mytuple)
mytuple[index]
mytuple[first:last]
mytuple = tuple + tuple2

Python Dictionary​

  • a collection of items represented as key-value pairs
  • unordered, indexed by uniaue keys
  • itmes are mutable
  • allow duplicate values but not duplicate keys
mydata = {
"name": "Tom",
"age": 30,
"role": "admin"
}

mydata.keys()
len(mydata)
mydata[key]
mydata[key] = new-value
del mydata[key]
del mydata

# Deletes an entry associated with key
val = mydata.pop(key)
# Updates/Inserts { k: v } entry into the dictionary
mydata.update({ k: v })

Java List​

  • an interface of the Java Collection Framework (JCF)
  • cannot be instantiated.
  • common implementation of List interface
    • ArrayList
    • LinkedList
List<Integer> numbers = new ArrayList<>();
List<String> names = new LinkedList<>();

numbers.get(0);
numbers.get(numbers.size() - 1);

names.get(indexOf("Hello"));
names.get(lastIndexOf("Hello"));

numbers.add(5);
names.remove("Hello");
names.remove(indexOf("Hello"));

numbers.removeAll(<another list>);
// set(2, 12) replaces the item at index 2 with 12
numbers.set(2, 12);

Java Set​

  • an interface of the Java Collection Framework (JCF)
  • unordered, unique objects.
HashSet<String> names = new HashSet();
HashSet<String> names = new HashSet(Array.asList("Tom", "Jerry", "Mickey"));

HashSet<String> names = new HashSet();
ArrayList list1 = new ArrayList();
ArrayList list2 = new ArrayList();

list1.add("Tom");
list1.add("Jerry");

names.addAll(list1);
names.addAll(list2);

names.remove("Tom");
boolean isRemoved = names.remove("Tom");

for (String name : names) {
System.out.println(name);
}

Iterator<String> it = names.iterator();
while (it.hasNext()) {
System.out.println(it.next());
}

names.clear();
names.isEmpty();
names.contains("Tim");
names.size();
names.removeAll(set2);
names.containsAll(set2);
// Retain set2 elements and discard the rest
names.retainAll(set2);

Java Map​

  • interface from java.util stores data as a keiy-value pairs
  • contain unique keys that are associated with specific values.
HashMap<Integer, String> people = new HashMap<>();
people.put(1, "Tom");
people.put(2, "Jerry");
people.put(3, "Mickey");

people.putIfAbsent(2, "Donald");
System.out.println(people.get(2));

people.put(2, "Lucy");
people.replace(2, "Amy");
people.remove(2);

System.out.prinln(people.keySet());
System.out.println(people.values());

people.clear();
people.isEmpty();
people.containsKey(2);
people.size();
people.getOrDefault(50, "Unknown");
// Checks if the value is mapped with one or more keys
people.containsValue("Jim");

Operation Patterns​

  • Finding an item in a list: Using the lookup pattern
  • Finding multiple items in a list: Using the updated-lookup pattern
  • Removing certain items from a list: Using the remove-all pattern

Sentence structures

· 약 4분

Types of sentence structure​

The secret to good writing is variation and using a mix of these types of sentences within your paragraphs in your written work.

  • Simple sentence
    • is one independent clause in a subject-verb pattern
    • e.g. The Australian government introduced an official carbon tax on 1 July 2012.
  • Compound sentence
    • is two independent clauses connected by a coordinating conjunction.
    • e.g. The Australian government introduced an official carbon tax on 1 July 2012, but this was met with opposition from the general public.
  • Complex sentence
    • consists of an independent clause and a dependent clause.
    • e.g. As the Australian government recognized the necessity to significantly reduce greenhouse gas emissions, it introduced an official carbon tax on 1 July 2012.
  • Compound-complex sentences
    • consists of more than one independent clause and one or more dependent clauses
    • e.g. As the Australian government recognized the necessity to significantly reduce greenhouse gas emissions, it introduced an offical carbon tax on 1 July 2012, but this was met with opposition from the general public.

Common sentence structure errors​

Sentence fragments​

  • A sentence fragment is missing some of its parts.
  • There are three main reasons why a sentence may be incomplete.
    • Missing subject
      • e.g Becoming extinct because of rising sea tempratures.
      • Correction: Phytoplankton could become extinct because of rising sea temperatures.
    • Missing verb
      • e.g. Significantly, one particular form of Western Australian finch.
      • Correction: Significantly, one particular form of Western Austrailan finch has decreased in numbers.
    • Incomplete thought
      • e.g. In a recent article about loss of habitat due to climate change.
      • Correction: In a recent article about loss of habitat due to climate change, Australian animals were shown to be particularly vulnerable.
  • Sentences beginning with words like so, as, because, who, which, that are often incomplete.

Run-on sentences​

  • A run-on sentence occurs when two simple sentences are incorrectly joined. e.g. Poverty, famine and major public health problems around the developing world are important indicators of a changing climate these issues are not being addressed globally.
  • Use a joining or linking word such as and, but, or, nor, for, so, yet.
    • Correction: Poverty, famine and major public health problems around the developing world are important indicators of a changing climate, but these issues are not being addressed globally.
  • Make two separate sentences.
    • Correction: Poverty, famine and major public health problems around the devleoping world are important indicators of a chaing climate. These issues are not being addressed globally.

Lack of Meaning​

  • Ensure that each sentence you write has clear meaning in English.
  • It must be fully understandable when read.
  • If you ware not sure if your sentence has clear meaning in English, perhaps think about rewriting it in a simpler and clearer way that you can fully understand (as will hopefully your reader).

Tips for writing​

  • Consider the following example where each sentence follows a similar structure.
    • Topic Sentence: main point of the paragraph.
    • Supporting Sentence: Examples, evidence, or analysis.
    • Concluding Sentence: wrap up paragraph by linking to broader topic, or linking to the next paragraph or section.
  • This uniformity leads to a lack of cohesion, making the paragraph feel disjointed and somewhat monotonous.
    • e.g. Nursing education states that measures should be in place to avoid infection. Also, that infection rates tend to soar when hygiene standards decrease. Appropriate steps should be taken to decrease these risks. It is suggested that medical staff are educated to understand these risks.
    • Correction: Nursing educators argue that strict measures should be implemented to avoid infection in medical institutions. There is also much evidence to demonstrate that infection rates rise dramatically when hygiene standards begin to fall. Therefore, it is argued that appropriate steps need to be in place to decrease and minimize these potential risks. Furthermore, aggressive steps should be taken to ensure that all staff maintain effective hygiene and infection control.

Ref​

VLA Test Review

· 약 6분

VLATest: Testing and Evaluating Vision-Language-Action Models for Robotic Manipulation​

  • VLATest fuzzes 18,604 manipulation scenes (10 operators, 4 tasks) to systematically stress-test VLA robustness.
  • Seven VLA models show low success and brittleness to confounders, lighting/camera changes, unseen objects, and instruction mutations; larger pretraining helps.
  • Priorities: scale/augment demo data (incl. sim2real), use stepwise/CoT prompting & multi-agent setups, and expand benchmarks with online risk assessment.

Motivation & Gap​

  • Problem: Current VLA models are typically evaluated on small, hand-crafted scenes, leaving general performance and robustness in diverse scenarios underexplored.
  • Goal: Introduce VLATest, a generation-based fuzzing framework that automatically creates robotic manipulation scenes to test performance and robustness of VLA models.

What Are VLA Models?​

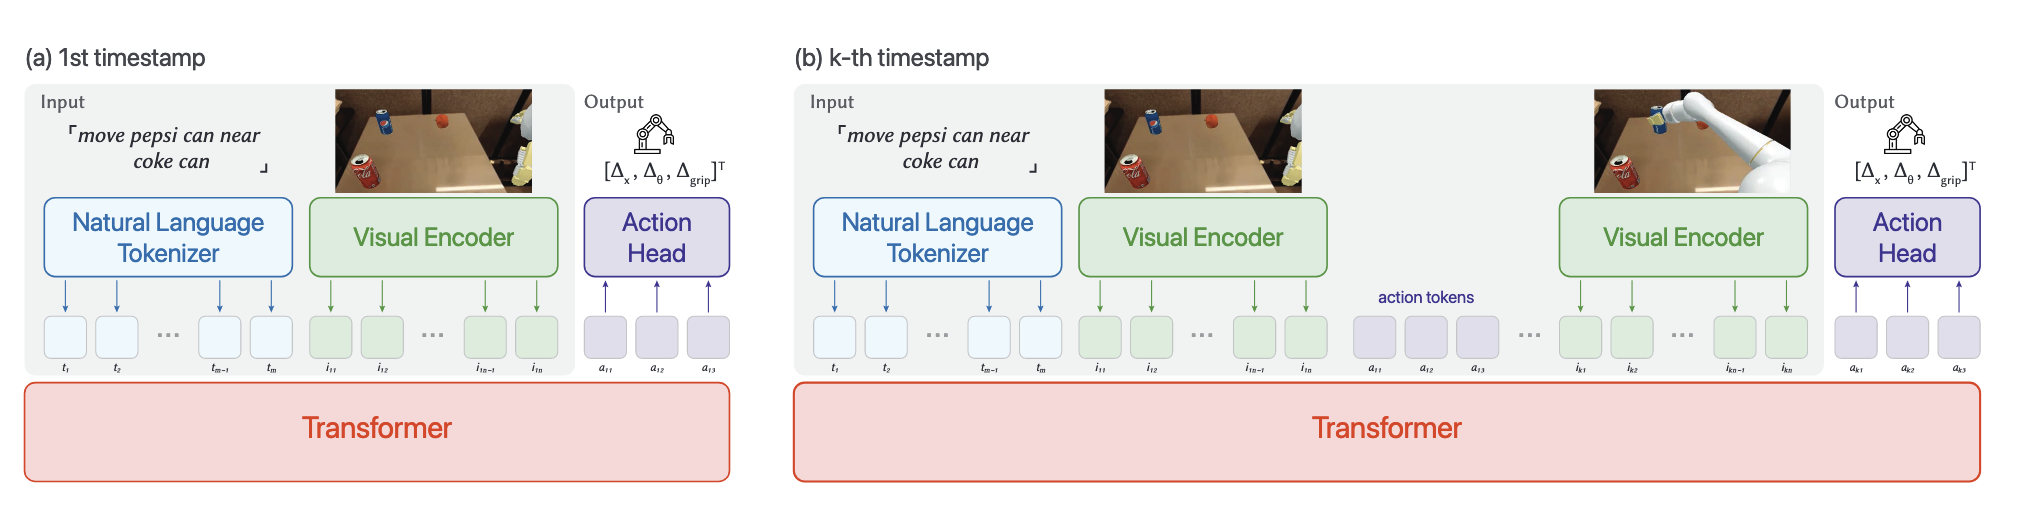
  • Vision-Language-Action (VLA) models take natural language instructions + camera images and output low-level robot actions (Δx, Δθ, Δgrip).
  • Inference loop: Tokenize text/image → transformer predicts action token A₁ → execute → append A₁ + new image tokens I₂ → predict A₂ → … until success or step limit.

VLA Architecture

Training & Evaluation​

  • Training: (1) Train from scratch on robot demonstrations, or (2) fine-tune a large VLM (e.g., Llava) with >1B params pretraining.
  • Evaluation: Task-specific metrics (e.g., grasp, lift, hold for “pick up”), either in sim (auto-metrics) or real (manual labels).

VLATest Framework​

  • Ten testing operators grouped across:
    • Target objects: type, position, orientation
    • Confounding objects: type, position, orientation, count
    • Lighting: intensity
    • Camera: position, orientation
  • Scene generation (Alg. 1): sample valid targets → (optional) confounders → mutate lighting (factor α) → mutate camera pose (d, θ). Semantic validity checks prevent infeasible scenes.

VLA Test

Research Questions (RQ)​

  • RQ1: Basic performance on popular manipulation tasks
  • RQ2: Effect of confounding object count
  • RQ3: Effect of lighting changes
  • RQ4: Effect of camera pose changes
  • RQ5: Robustness to unseen objects (OOD)
  • RQ6: Robustness to instruction mutations

Tasks & Prompting​

  • Tasks:
    1. Pick up an object (grasp + lift ≥0.02 m for 5 frames)
    2. Move A near B (≤0.05 m)
    3. Put A on B (stable stacking)
    4. Put A into B (fully inside)
  • Standard prompts (RQ1–RQ5):
    • pick up [obj] · move [objA] near [objB] · put [objA] on [objB] · put [objA] into [objB]
  • Instruction mutations (RQ6): 10 paraphrases per task (GPT-4o), manually validated for semantic equivalence.

Experimental Setup​

  • Scenes: 18,604 across 4 tasks (ManiSkill2).
  • Models: 7 public VLAs (RT-1-1k/58k/400k, RT-1-X, Octo-small/base, OpenVLA-7b).
  • Compute: >580 GPU hours.

Key Results & Findings​

RQ1 — Overall Performance​

  • VLA models underperform overall; no single model dominates across tasks.
  • Example best-case rates (default settings): 34.4% (Task1, RT-1-400k), 12.7% (Task2, OpenVLA-7b), 2.2% (Task3, RT-1-X), 2.1% (Task4, Octo-small).
  • Stepwise breakdown (Task 1): grasp 23.3% → lift 15.7% → hold 12.4% ⇒ difficulty composing sequential actions.
    • Implication (Finding 2): Consider stepwise prompting / chain-of-thought to decompose complex tasks.

RQ1 — Coverage Metric​

  • No established coverage for VLA; adopted trajectory coverage (pragmatic).
  • Increasing cases from n=10 to n=1000 achieved 100% coverage across tasks (object-position novelty relative to workspace).

RQ2 — Confounding Objects​

  • More confounders ⇒ worse performance; models struggle to locate the correct object.
  • Similarity doesn’t matter much: Mann–Whitney U shows no significant difference between similar vs dissimilar distractors (p = 0.443, 0.614, 0.657, 0.443; effect sizes ≈ 0.23–0.29).

RQ3 — Lighting Robustness​

  • Lighting perturbations significantly hurt performance.
  • OpenVLA-7b most robust (77.9% of previously passed cases still pass), plausibly due to SigLIP + DINOv2 pretraining and LLaVA 1.5 mixture.
  • Sensitivity: even α < 2.5 increase drops success to ~0.7×; α > 8 ⇒ ~40% of default-pass scenes succeed.
  • Decreasing light hurts less than increasing; α < 0.2 still ~60% pass.

RQ4 — Camera Pose Robustness​

  • Small pose changes (≤5° rotation, ≤5 cm shift) reduce success to 34.0% of default.
  • RT-1-400k most robust (45.6% retain), OpenVLA-7b at 31.3%; Octo models <10%.
    • Likely due to training data scale differences.

RQ5 — Unseen Objects​

  • Using YCB (56 unseen objects) leads to large performance drops versus seen objects: avg –74.2%, –66.7%, –66.7%, –20.0% on Tasks 1–4.
  • Transfer rate across steps:
    • Trn=Success ratenSuccess raten−1\displaystyle T_r^n = \frac{\text{Success rate}_n}{\text{Success rate}_{n-1}}, with Success rate0=100%\text{Success rate}_0 = 100\%
    • Paired t-tests show significant differences on Tr1T_r^1 for Task 1 & 2 (p = 0.011, 0.007; Cohen’s d = 1.34, 0.891).
    • Primary failure mode: recognizing/locating unseen objects.

RQ6 — Instruction Mutations​

  • Mutated instructions generally reduce performance (avg drops: –32.8% T1, –1.7% T2, –8.3% T3; negligible on T4).
  • Larger language backbones help: OpenVLA-7b (Llama 2-7B) is more robust, sometimes improving under mutations (e.g., T1, T4).

Implications & Directions​

  • Scale matters: larger pretraining and robot-demo datasets improve robustness (lighting/camera).
  • Data enrichment: use data augmentation and sim-to-real to diversify external factors; leverage traditional controllers to auto-generate demonstrations.
  • Prompting strategies: adopt stepwise/CoT prompting; consider multi-agent decompositions.
  • Benchmarking: the 18,604 VLATest scenes serve as an early benchmark; expand to more tasks/robots/conditions.
  • Online risk assessment: explore uncertainty estimation and safety monitoring for runtime quality control.
  • Robotics foundation models: (1) LLMs for planning/rewards; (2) Multi-modal FMs (VLMs/VLAs) for manipulation & perception.
  • CPS testing: gray-box/black-box fuzzing and search-based testing exist, but not directly applicable to VLAs (multimodality, autoregression, scale).
  • FM evaluation: beyond static benchmarks, VLATest dynamically generates 3D manipulation test cases—distinct from text-only testing.

Threats to Validity (mitigations in study)​

  • Internal: randomness (mitigated by 18,604 scenes); potential prompt bias (mutations manually validated).
  • External: generalization to other tasks/models; chose popular tasks (Open X-Embodiment) and SOTA public models.
  • Construct: limited operators (lighting/camera/confounders chosen; future: #lights, camera intrinsics, resolution).
    • Coverage: trajectory coverage used as a pragmatic proxy.

Conclusion​

  • VLATest: early, generation-based fuzzing framework (10 operators) for VLA testing in ManiSkill2.
  • Empirical evidence across 7 models / 4 tasks / 18,604 scenes shows limited robustness (lighting, camera, unseen objects, instruction variation).
  • Points to data scaling, prompting, benchmarking, and risk assessment as practical paths to more reliable VLA systems.

Ref​

  • Wang, Z., Zhou, Z., Song, J., Huang, Y., Shu, Z., & Ma, L. (2025). VLATest: Testing and Evaluating Vision-Language-Action Models for Robotic Manipulation. Proceedings of the ACM on Software Engineering, 2(FSE), 1615–1638.