Octo Review
· 약 4분
Octo
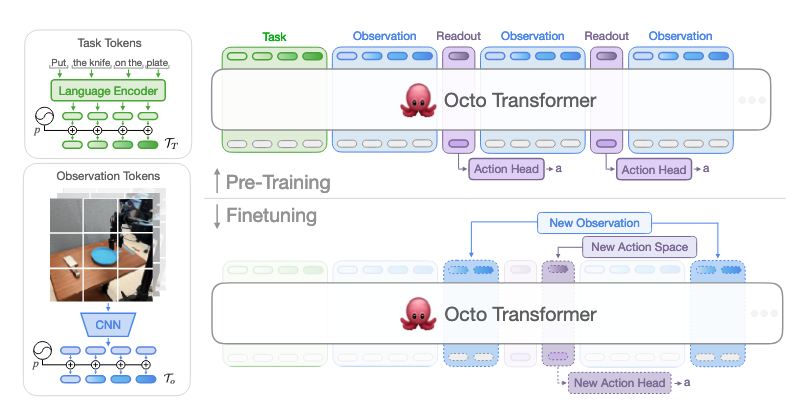
- Octo is a transformer-based policy with modular tokenizers (language via T5, images via CNN patches), blockwise masking, and readout tokens, trained on 800k multi-robot trajectories.
- Actions are generated through a diffusion head that produces continuous, multimodal, chunked predictions, enabling precise control and broad generalization.
- It achieves state-of-the-art zero-shot performance across 7 robots and allows efficient finetuning to new sensors and action spaces, while being fully open-source.
| Category | Simple Analogy | Actual Tokenization |
|---|---|---|
| Language | [Sentence] | [l₁, l₂, l₃, …] → multiple tokens from a tokenized sentence |
| Goal Image | [Goal] | [g₁, g₂, g₃, …] → image split into patches |
| Observation (time t) | [Observation] | [oₜ¹, oₜ², oₜ³, …] → camera frames/sensors tokenized into patches |
| Readout Token | [ ] (empty slot) | [TR,t] → one per timestep, reserved for predicting actions |
Time t-1: [l] [g] [o_{t-1}] [TR,t-1]
Time t:   [l] [g] [o_t]     [TR,t]
Time t+1: [l] [g] [o_{t+1}] [TR,t+1]

[TR,t-1], [TR,t], [TR,t+1]  ──►  Diffusion head  ──►  [a_t, a_{t+1}, …]
Motivation
- Traditional robot learning trains policies from scratch on robot/task-specific datasets → costly data collection, narrow generalization.
- Generalist Robot Policies (GRPs) pretrained on diverse robots/tasks can be finetuned with little in-domain data while generalizing broadly.
- Real-world deployments face challenges across robot embodiments, sensor setups, action spaces, task specs, and environments.
Prior GRPs & Gaps
- GRPs aim for low-level visuomotor control across tasks, environments, and robotic systems.
- Existing models often have restricted inputs (e.g., a single camera), lack efficient finetuning to new domains, and importantly, largest models are not publicly available.
Contribution (What is Octo?)
- Octo: a large transformer-based policy trained on 800k trajectories from the Open X-Embodiment dataset.
- Accepts language instructions or goal images, and can be finetuned within hours on consumer GPUs to new sensors and action spaces.
- First GRP to support effective finetuning to new observations and actions and to be fully open-source (training pipeline, checkpoints, data).
- Novelty lies in combining: transformer backbone + language/goal image conditioning + diffusion head for expressive action distributions.
Architecture
- Input tokenizers:
- Language via pretrained T5-base
- Images via shallow CNN → patch tokens
- Transformer backbone: processes unified token sequence.
- Blockwise masking + Readout tokens:
- Nonexistent modalities are masked
- Readout tokens only attend to past observations/tasks, not vice versa
- Diffusion action head: predicts continuous, multimodal, chunked actions.
- Modularity: new sensors/outputs can be added by only training lightweight encoders or heads; pretrained backbone remains unchanged.
Training Data & Objective
- Mixture of 25 heterogeneous robot datasets: diverse robots, sensors (with/without wrist cams), labels (with/without language).
- Conditional diffusion decoding predicts continuous, multimodal action distributions.
- Transformer runs one forward pass; denoising steps are contained in the small diffusion head.
Experiments
- Evaluated on 7 robotic platforms across 4 institutions.
- Key questions:
- Zero-shot multi-robot control?
- Do Octo weights improve finetuning vs. scratch or standard pretrained representations?
- Which design choices matter for generalist robot policies?
Results
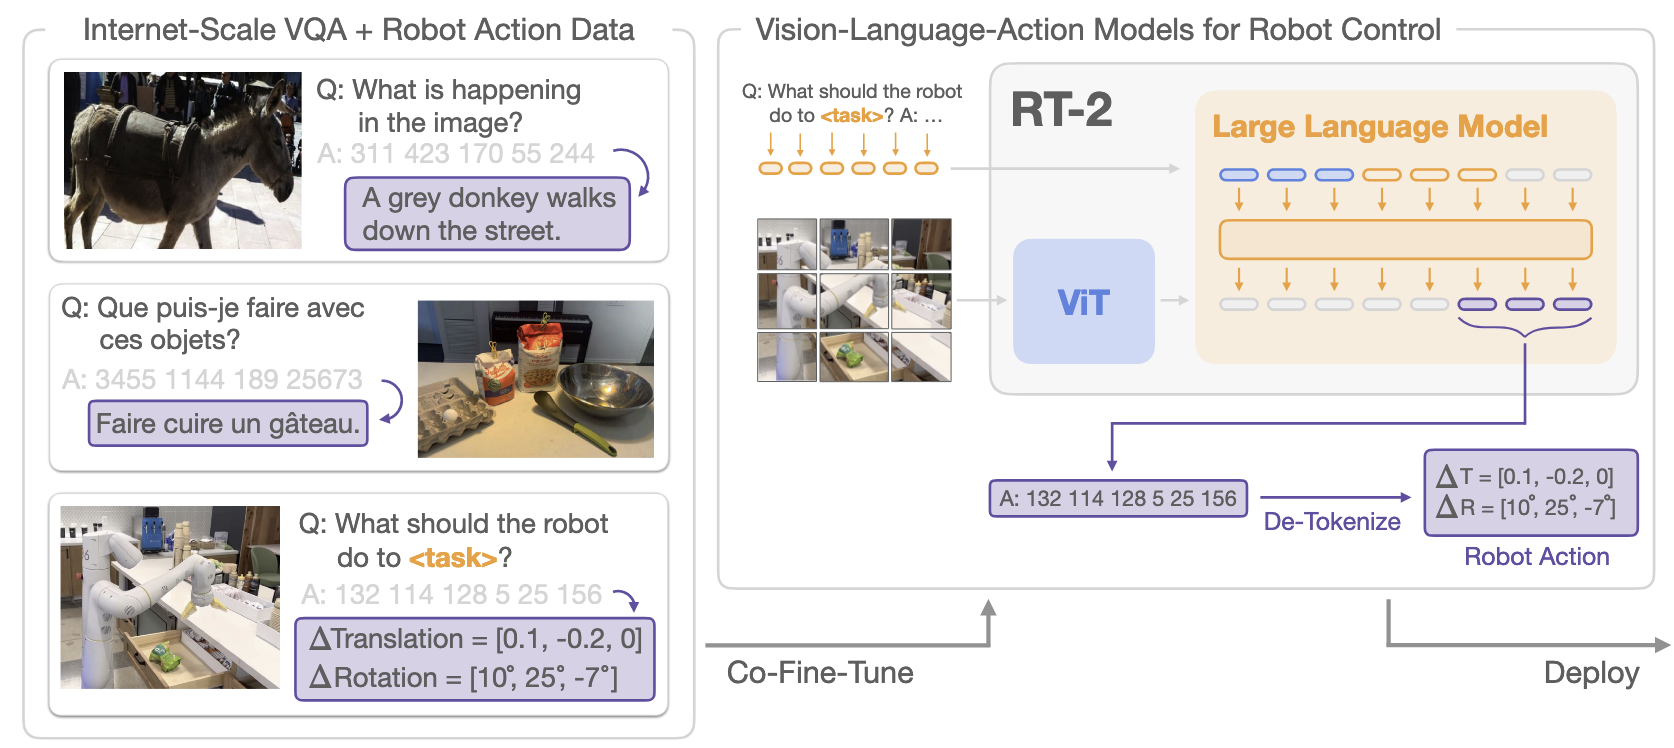
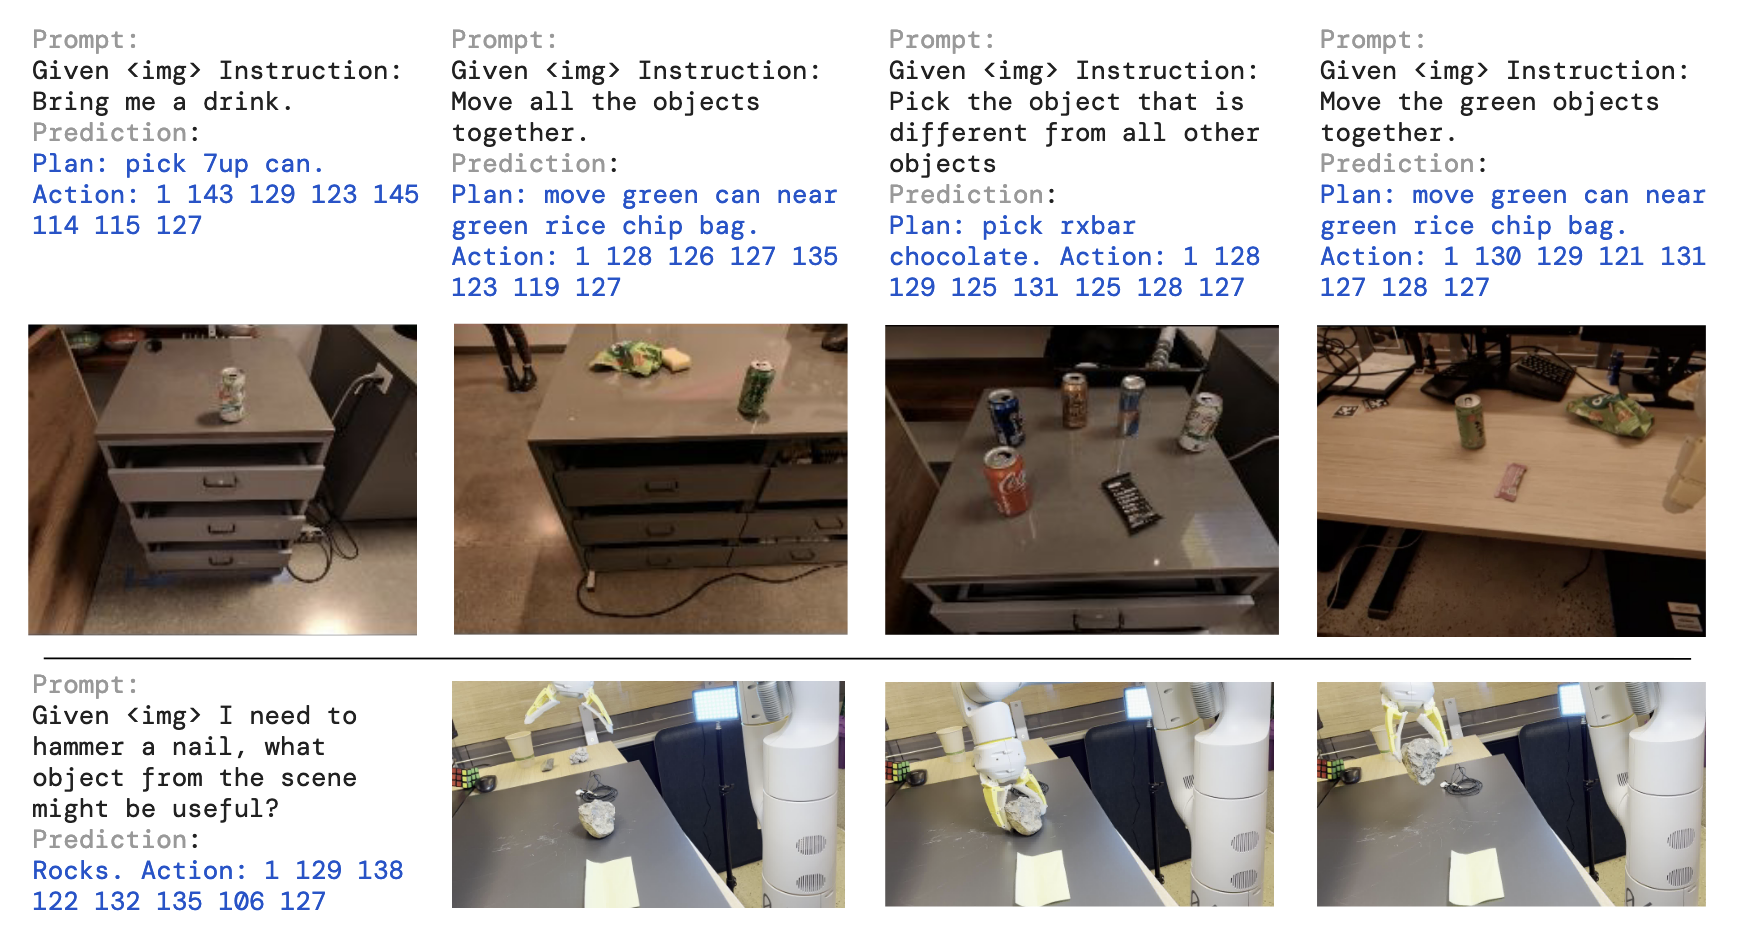
- Achieves state-of-the-art zero-shot multi-robot control, competitive with RT-1-X and RT-2-X.
- Provides a versatile policy initialization: significantly outperforms baselines for data-efficient finetuning to new obs/action spaces.
Limitations / Future Work
- Needs better language conditioning, improved wrist camera support, and data beyond optimal demonstrations.
One-line Takeaway
- Octo = modular, efficient, open-source GRP:
A transformer + diffusion policy trained on large-scale multi-robot data that adapts quickly with little in-domain data to new sensors and action spaces, enabling broad generalization.
Ref
- Mees, O., Ghosh, D., Pertsch, K., Black, K., Walke, H. R., Dasari, S., Hejna, J., Kreiman, T., Xu, C., & Luo, J. (2024). Octo: An open-source generalist robot policy. First Workshop on Vision-Language Models for Navigation and Manipulation at ICRA 2024.