4 posts tagged with "ippr"

View All Tags

IPPR 005

· 2 min read

Pattern recognition

  • recognizing patterns of interest oin data
  • applications
    • image and video analysis
    • speech analysis
    • natural language processing
    • genomic research and bioinformatics
    • data mining and analytics for business, finance, marketing, trade
    • network traffic analysis
    • analysis of Web data
    • social media analysis

ML Problems

  • Classification: predict a categorical value from an array of numerical/categorical features.
    • The input is assigned to the class with the highest score/probability.
  • Regression: predict a numerical value from an array of numerical/categorical features.
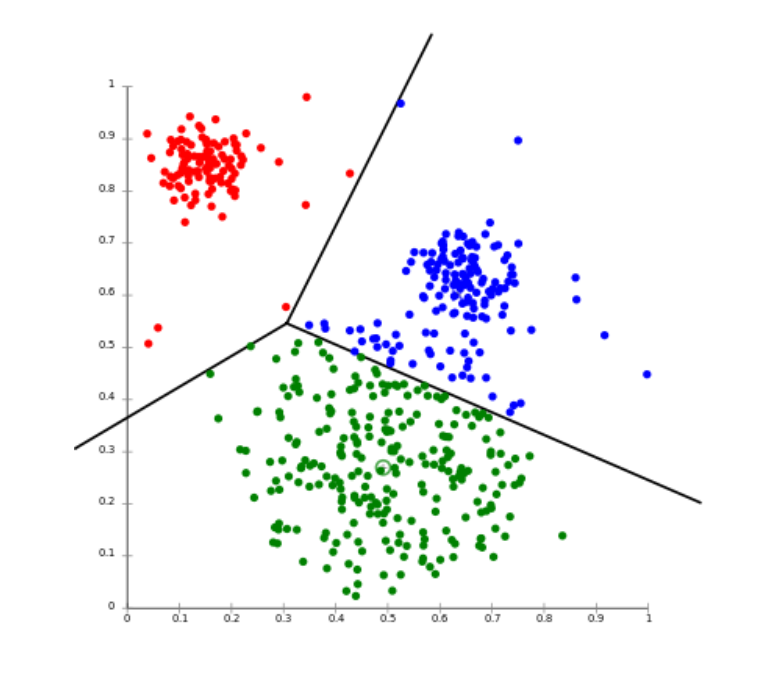
  • Clustering: group numerical data homogeneously into clusters.

Probabilistic Classifier

  • The class scores are simply bounded between 0 and 1 and add up to 1 over all classes.
  • probability of class cc given input xx, or p(cx)p(c|x).
    • p(c=applex)=0.7p(c = \text{apple}|x) = 0.7
    • p(c=bananax)=0.2p(c = \text{banana}|x) = 0.2
    • p(c=orangex)=0.1p(c = \text{orange}|x) = 0.1
  • All contemporary deep learning classifiers are probabilistic.
  • Training objective: assign the largest possible probability to the correct labels.

Hyperparameters

  • Type of model: logistic regression, CNN, random forest, SVM etc.
  • Size of a mask (3x3, 5x5) or of feature vector (100, 200)
  • Number of clusters
  • All discrete choices and any coefficient within the loss function.

Datasets

  • Training set: it is used with the loss function to automatically find the optimal parameters for various, arbitrarily chosen values of the hyperparameters
  • Validation set: it is used to find the best values for the hyperparameters (best performance evaluation metric)
  • Test set: it is used with the chosen parameters and hyperparameters to measure and report the final model’s accuracy/performance
  • K-means
  • K-medoids, or PAM (partitioning around medoids)
  • Other female-named clustering algorithms:
    • AGNES
    • DIANA
    • DAISY

Models

  • U-Net: Classify individual pixels rather than entire images
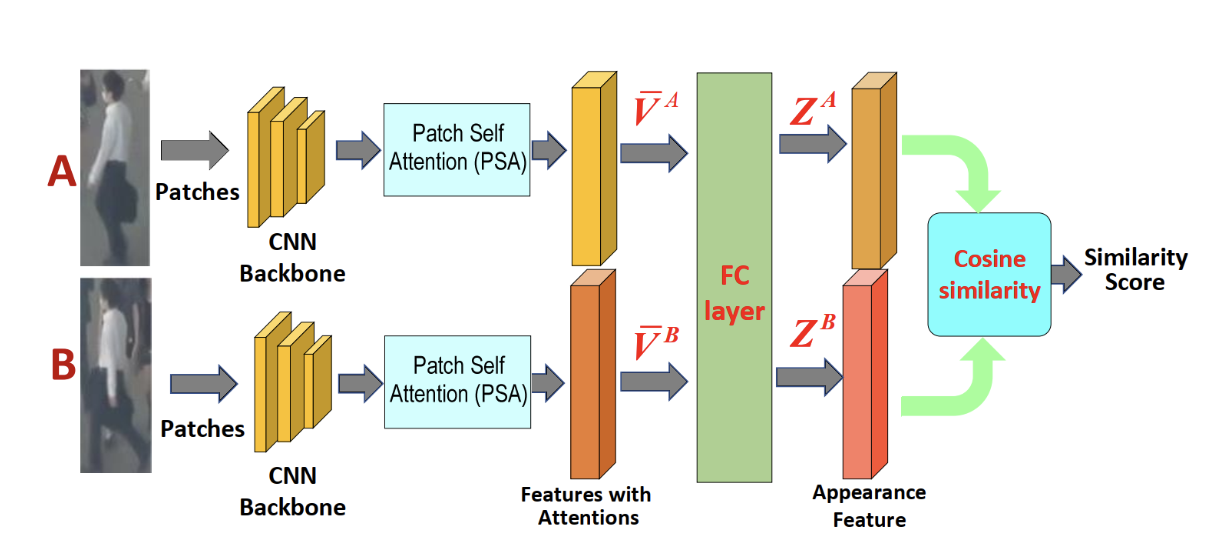
  • SMILETrack: track objects in video having a certain shape

SMILETrack

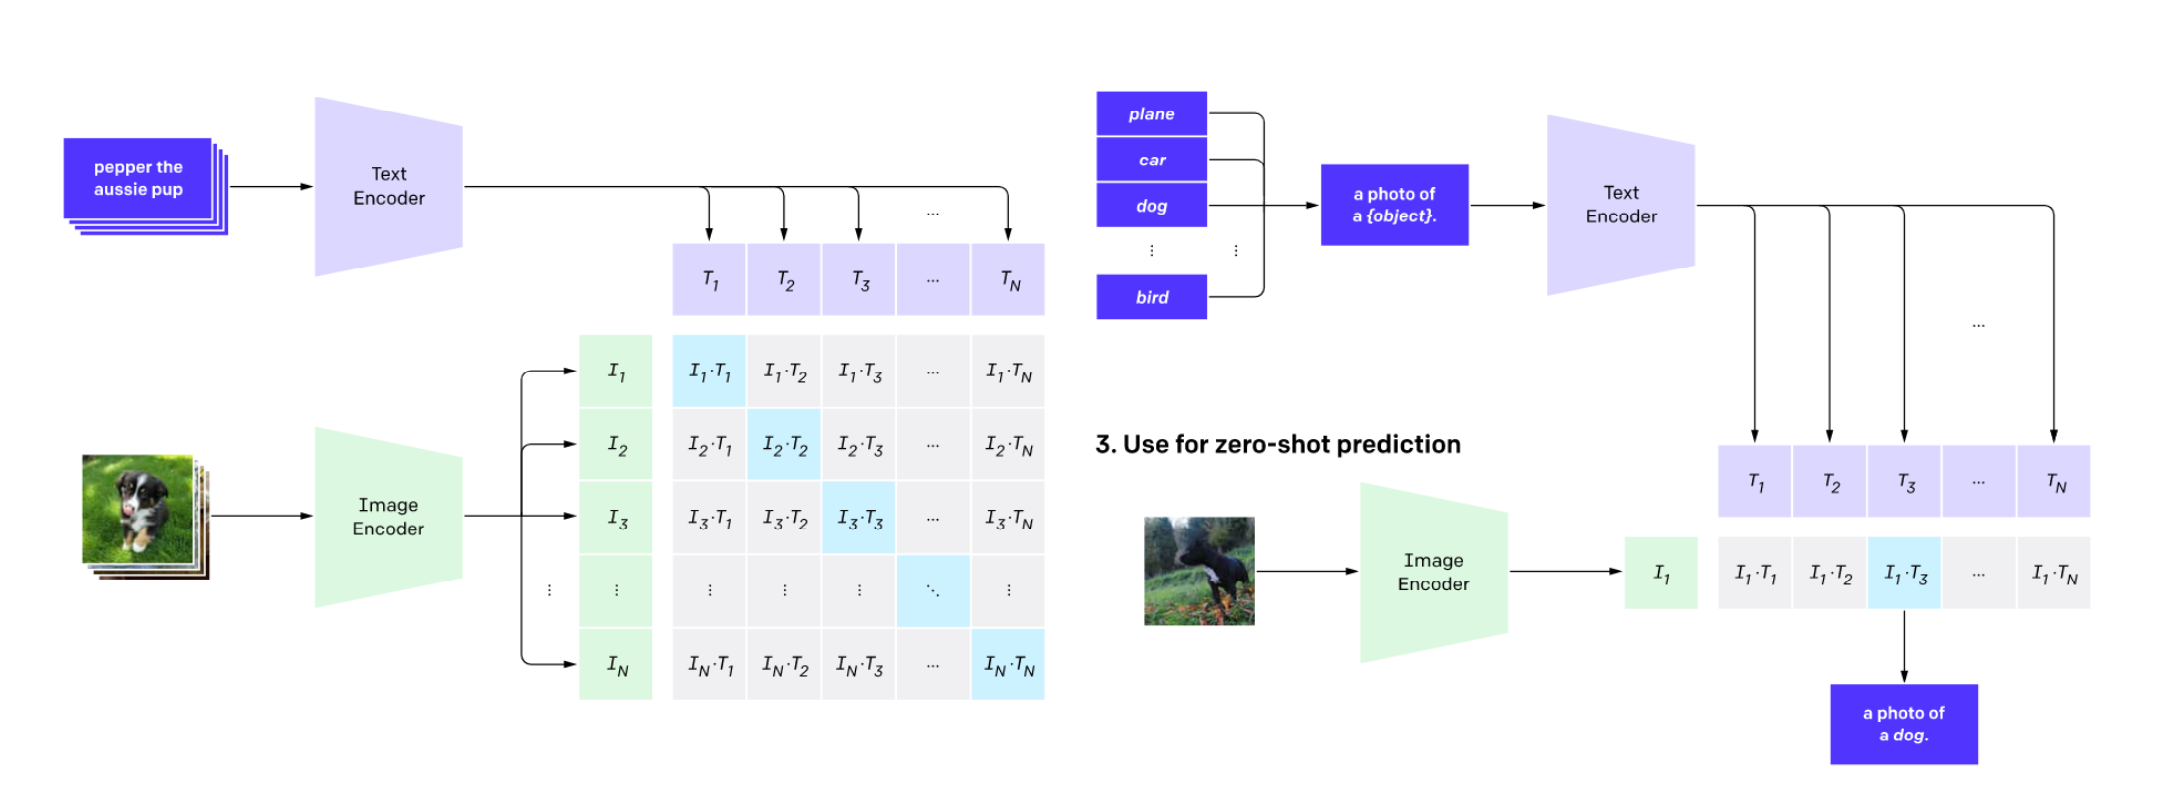
  • OpenAI CLIP: Trained with pairs of images and captions, and at run time is able to classify images into any category of choice

CLIP

  • Stable Diffusion

IPPR 004

· 13 min read

3D Taxonomy

  • Explicit representations store geometric structure directly.
    • The geometry can be directly inspected as points, voxels, vertices, faces, or primitives.
  • Implicit representations encode 3D structure indirectly.
    • Geometry must be inferred, reconstructed, or queried from a function, field, or set of observations.
  • Discrete representations consist of a finite set of elements or samples.
  • Continuous representations define information over a continuous spatial domain.
  • Explicit + Discrete
    • Voxel grids divide 3D space into uniform volumetric cells.
    • Octrees are hierarchical volumetric representations that adapt resolution to spatial complexity.
    • Point clouds represent a scene as a set of 3D points.
    • 3D Gaussian Splatting represents a scene as a finite set of Gaussian primitives.
    • Meshes represent surfaces using vertices, edges, and faces.
  • Implicit + Discrete
    • Light fields and multi-view representations store sampled observations rather than explicit geometry.
  • Implicit + Continuous
    • Neural Radiance Fields represent a scene as a continuous function mapping coordinates and viewing directions to density and color.
    • Holography represents 3D information through optical wave or phase fields.

Classic 3D Representations

Point Cloud

  • The simplest form of a 3D model, a collection of 3D coordinates of each point plotted in 3D space.
    • Color
    • Reflectance
    • Normals
    • Semantics
  • May be unstructured or be defined on a grid.
  • Native output of sensors (LiDAR, MVS)
  • Static Point Cloud: a single 3D frame without a temporal dimension.
  • Dynamic Point Cloud: a sequence of point-cloud frames over time.
    • Dynamic point clouds capture motion and temporal changes in 3D scenes.
    • Instead of encoding every frame independently, changes between frames can be encoded.
  • Pros: Flexible, Easy capture
  • Cons: No topology, Hard to render well, Coding complexity
  • Photogrammetry: science of making measurements from photographs
    • it uses photos of an object taking a different locations
  • Vertices -> Edges -> Faces -> Polygons -> Surfaces
  • PCL: Point Cloud Library
Point 1 = (1.27, 3.14, 2.81), red
Point 2 = (1.31, 3.12, 2.79), red
Point 3 = ...

Voxels

Volumetric Pixel

  • Divided scene into a regular 3D grid
  • Instead of encoding the location of each point, encode if the position in the grid is occupied or not and the color at that point.

Voxel(i,j,k)=[xi,xi+Δ]×[yj,yj+Δ]×[zk,zk+Δ]\text{Voxel}(i,j,k) = [x_i, x_i+Δ] × [y_j, y_j+Δ] × [z_k, z_k+Δ]

Voxel[0,0,0] = empty
Voxel[0,0,1] = occupied, red
Voxel[0,0,2] = occupied, blue
Voxel[0,0,3] = empty
  • Pros:
    • Regular grid makes processing easier
    • No need to store explicit coordinates for every occupied voxel; its position is determined by the grid index.
  • Cons:
    • No explicit surface topology
    • Hard to render
    • Lots of wasted space if most voxels are empty.

Octrees

  • Divide space coarsely into 8 blocks.
    • If a block contains geometry and the desired resolution has not been reached, subdivide it into 8 sub-blocks.
  • Record whether a block is subdivided and link it to its children.
  • Continue subdividing until the desired resolution is reached or the block is empty.
  • At the target resolution, occupied leaf nodes represent the geometry.
    • Empty regions do not need to be subdivided further.
    • Internal nodes are not empty; they represent regions that have been subdivided.
  • Pros:
    • Hierarchical, semi-regular grid structure makes spatial processing easier.
    • No need to store explicit coordinates for every occupied element; its position is determined by the path through the tree.
    • Less wasted space than a dense voxel grid.
    • Adaptive resolution: empty or simple regions can remain coarse, while complex regions can be subdivided further.
  • Cons:
    • No explicit surface topology, unlike meshes.
    • Rendering is less direct because the tree must be traversed to find occupied regions.
    • Random access is more expensive than in a regular voxel grid because reaching an element requires tree traversal.
    • Tree structure introduces additional memory and traversal overhead.

Meshes

  • Represent surfaces using connected vertices, edges, and faces.
  • Pros:
    • Compact representation of surfaces.
    • Hardware-friendly, especially for GPU rendering.
    • Strong ecosystem and broad support in graphics software and hardware.
  • Cons:
    • Complex appearance may require additional textures, materials, or shaders.
    • Sensitive to noise when reconstructed from captured 3D data.
    • Requires explicit topology, which can be difficult to estimate from raw point clouds or scans.
Point Cloud
● ● ●

→ 점만 있음

Mesh
●────●
│ /│
│ / │
●────●
→ 어떤 점이 연결되어 surface를 만드는지 알고 있음

Limitations of Geometry Focused Representations

  • Geometry does not fully determine appearance.
  • Appearance also depends on lighting, material properties, and viewing direction.
  • Transparency, refraction, reflections, and view-dependent effects are difficult to represent using geometry alone.
    • Transparency: 유리처럼 뒤가 비쳐 보이는 현상
    • Refraction: 빛이 유리나 물을 통과하면서 방향이 꺾이는 현상
    • Reflection: 금속, 유리 등에 주변 환경이 반사되는 현상
    • View-dependency: 보는 방향에 따라 appearance가 달라지는 현상
  • Increasing demand for photorealistic rendering and novel-view synthesis exposes the limitations of geometry-only representations.

Light Fields and Multi-view Representations

  • Parallax
    • Apparent shift of objects caused by a change in viewpoint.
    • Nearby objects show a larger image shift than distant objects.
    • The amount of parallax provides information about depth.
  • Multi-view Representations
    • Capture the same scene from multiple viewpoints.
    • Differences between views can be used to recover the 3D structure of the scene.
    • Moving through the views creates a sense of 3D structure.
    • Intermediate views can be generated using view interpolation.
  • Light Fields
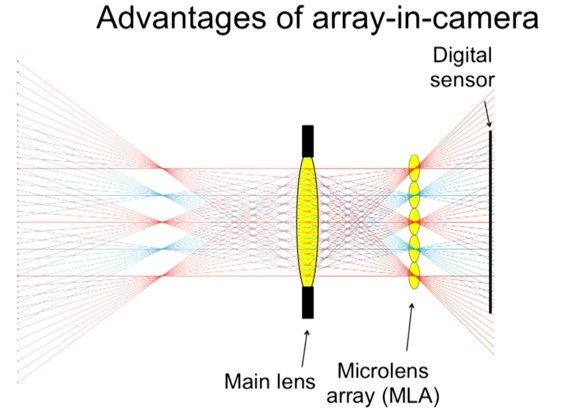
    • Capture both the position and direction of incoming light.
    • A microlens array separates light arriving from different directions.
    • A light field can be reorganized into many slightly offset sub-aperture views.
    • This is similar to capturing the scene from many nearby viewpoints.
  • Key Idea
    • Multi-view uses multiple viewpoints to capture parallax.
    • Light fields capture spatial and angular light information more densely.
    • Both can represent 3D structure without explicitly storing geometry.
  • Pros
    • Single-shot capture of multiple viewpoints or angular information (Light Field only).
    • High visual fidelity, including view-dependent appearance.
    • Supports computational re-focusing.
    • Can be converted into other representations, such as depth maps, novel views, or 3D geometry.
  • Cons
    • High data volume because many views or light-ray samples must be stored.
    • Light Field capture may require specialized camera hardware.
    • Direct Light Field viewing may require specialized display hardware.
    • Spatial or angular resolution can be limited because sensor resolution is shared across multiple views.

Light Field Re-focusing

  • Light Field Capture
    • Light field cameras capture light from multiple directions using a microlens array.
    • A single capture contains many slightly different sub-aperture views.
  • Re-focusing
    • Objects at different depths show different amounts of parallax across the views.
    • The views can be shifted so that objects at a selected depth align with each other.
    • Aligned objects become sharp when the views are combined.
    • Objects at other depths remain misaligned and appear blurred.
  • Virtual Lens
    • A virtual lens computationally reproduces the focusing behavior of a physical lens.
    • This allows the focus position to be changed after the image has already been captured.
  • Depth of Field
    • Depth of field is the range of depths that appear sharp.
    • Light field data can also be used to computationally change the depth of field after capture.

Holography

  • Reflect light off an object and record its wavefront as an interference pattern using a reference beam.
  • Recording
    • A laser is split into an object beam and a reference beam.
    • The object beam reflects off the object and carries the object's wavefront information.
    • A sensor can measure light intensity, but cannot directly measure phase.
    • The reference beam is combined with the object beam so their phase difference becomes a recordable interference pattern.
  • Reconstruction
    • A reconstruction beam is sent through the recorded interference pattern.
    • The hologram reconstructs the original wavefront, making the object appear in 3D.
  • Holography does not directly encode the object's geometry.
    • It encodes the structure of light reflected from the object.
  • Pros
    • Physically accurate reconstruction of light rays.
    • No explicit surface reconstruction required.
    • Quick capture.
  • Cons
    • High data volume.
    • Requires a stable coherent light source, usually a laser.
    • Difficult to capture colour and large scenes.
    • Holographic display hardware is expensive and complex.
    • Software reconstruction and post-processing are complex.
  • Application
    • Digital Holographic Microscopy (DHM) can reconstruct 3D structures such as red blood cells.
Object

Laser → Beam splitter ─────→ Object beam
│ ↓ 반사
│ ↓
└────────────→ Reference beam

[ Recording plate ]
두 빛이 만남

Interference pattern

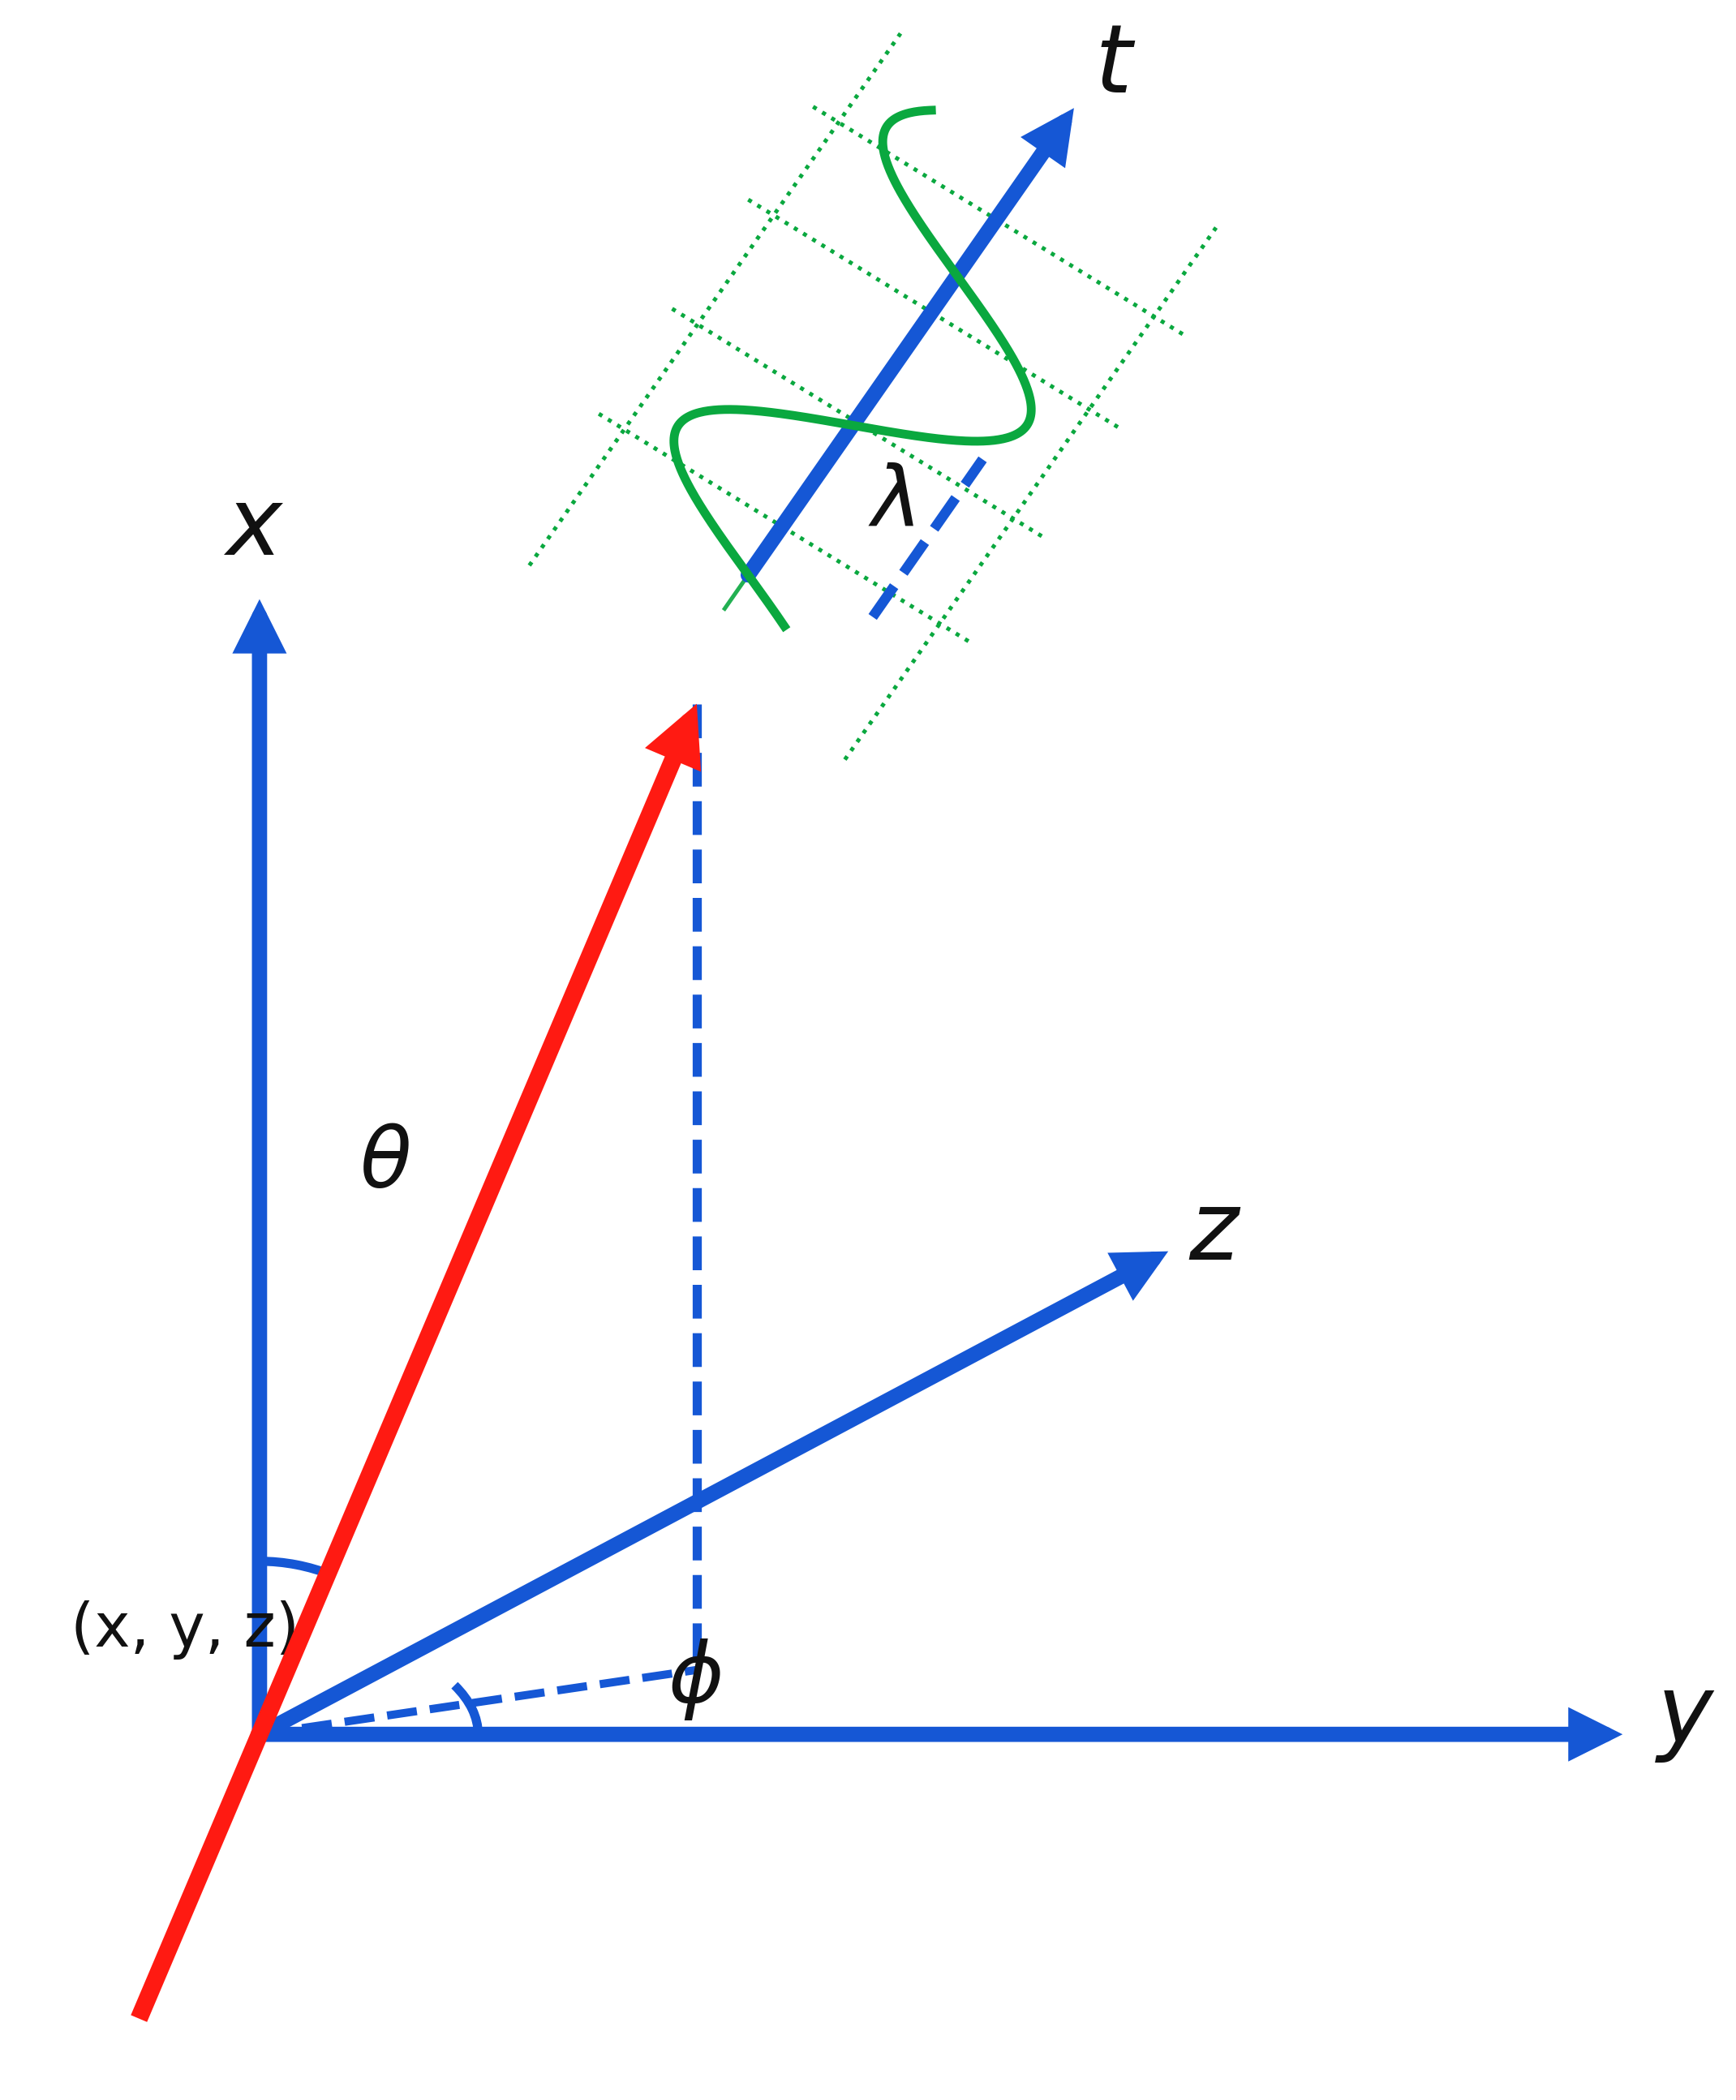
Plenoptic Function

L(x,y,z,θ,ϕ,λ,t)L(x, y, z, \theta, \phi, \lambda, t)

  • Models the intensity of every light ray in space and time
  • (x,y,z)(x, y, z): Spatial position
  • (θ,ϕ)(\theta, \phi): Viewing direction
  • λ\lambda: Wavelength (color)
  • tt: time

Plenoptic

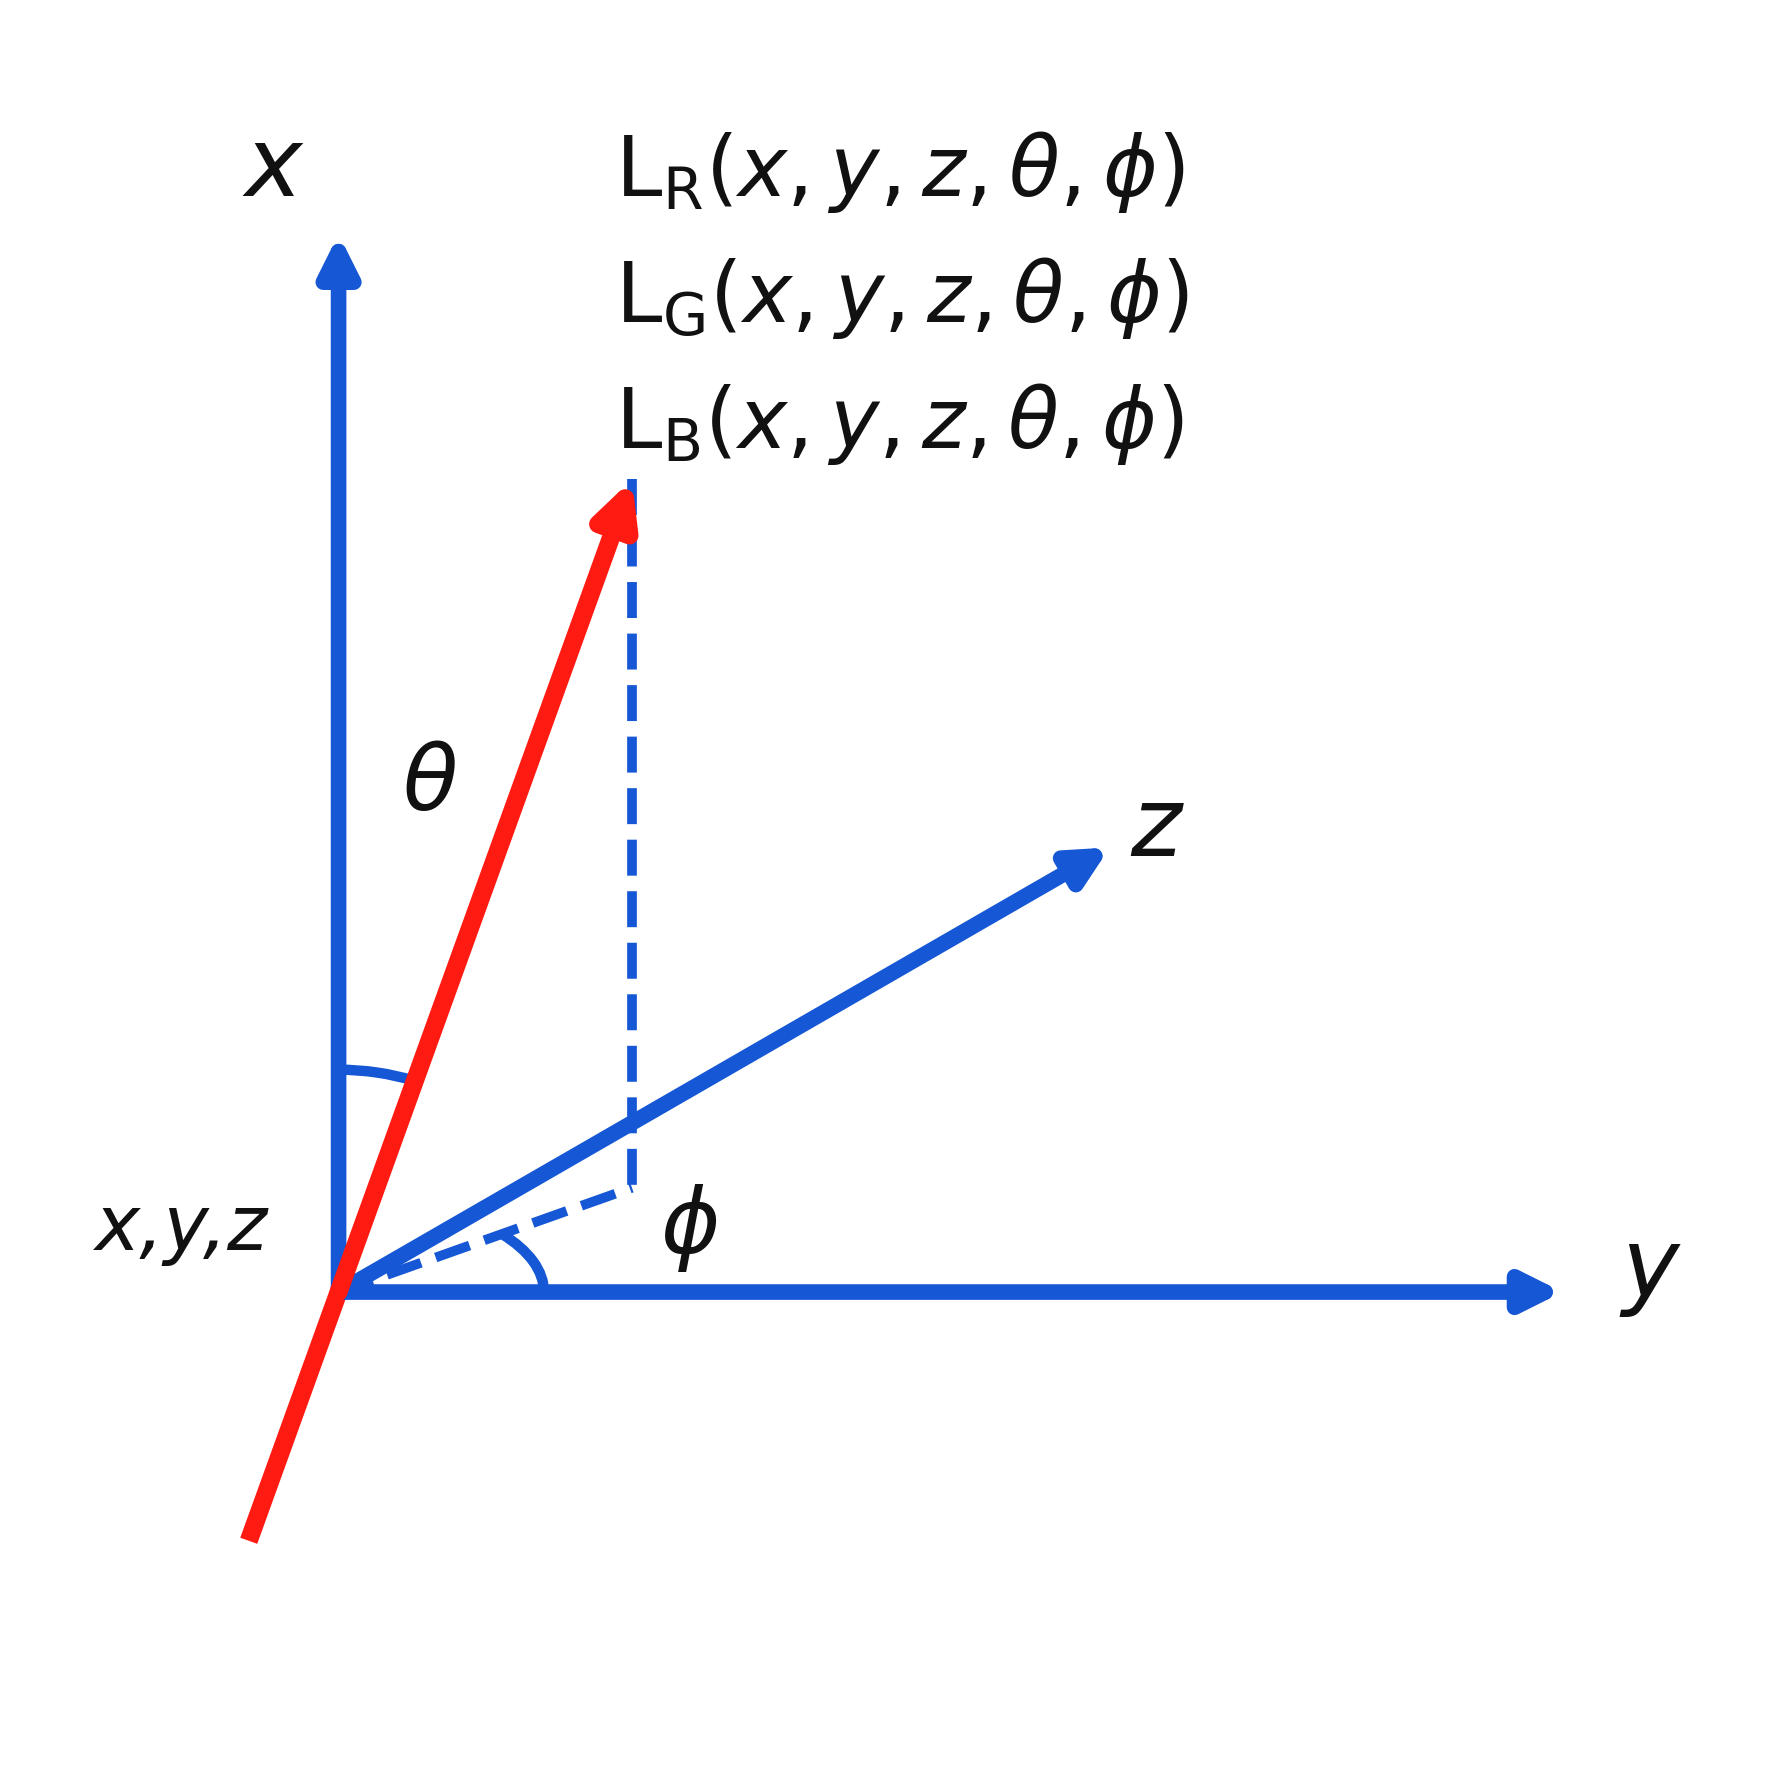
  • For human vision, wavelength information can be integrated into RGB channels:
    • LR(x,y,z,θ,ϕ,)L_R(x, y, z, \theta, \phi,)
    • LG(x,y,z,θ,ϕ,)L_G(x, y, z, \theta, \phi,)
    • LB(x,y,z,θ,ϕ,)L_B(x, y, z, \theta, \phi,)
  • If only a static image is needed, time can be fixed.
  • x, y, z specify the position of the light ray.
  • θ,ϕ\theta, \phi specify its direction.
  • The resulting function describes the RGB light traveling in a particular direction at a particular 3D position.
  • This reduces the representation to a 5D spatial-directional function for each RGB channel.
    • space 3D + direction 2D + wavelength 1D (Compressed to RGB) + time 1D (Fixed)

Plenoptic RGB

How Cameras Represent the Plenoptic Function

A camera image = integration of rays from the plenoptic function over all directions focused by a lens.

  • A camera samples the scene at discrete sensor pixels.
  • Multiple rays arriving at each pixel are integrated into a single pixel value.
    • The lens and aperture control which range of rays reaches the pixel.
  • Directional information is therefore mostly lost after the rays are integrated.
  • Adjusting the lens can change the range of integrated rays, affecting focus and depth of field.

How Light Fields Represent the Plenoptic Function

A light field image = discrete sampling of rays from the plenoptic function over preset directions focused by a lens.

  • A light field also samples the scene at discrete sensor positions.
  • Instead of integrating different ray directions, it samples them separately.
  • A microlens array separates incoming rays according to their directions.
    • Different directions are recorded by different sensor pixels/subpixels.
  • Camera arrays and lenslet arrays can collect similar multi-view/angular information.
  • More angular sampling provides more directional information, but increases data volume and reduces available spatial resolution.
  • Key difference
    • Normal camera: multiple directions → integration → one pixel value.
    • Light field: multiple directions → separate directional samples.

Light Field Cameras

Radiance Fields

래디언스 필드

RepresentationSpatial informationDirection informationResult
Traditional camerax, yIntegrated / collapsed2D image
Light fieldx, yθ, φ sampled separately4D image
Radiance fieldx, y, zθ, φ modelled continuously5D function
  • Traditional cameras
    • Integrate multiple incoming ray directions into each pixel.
    • Directional information is collapsed.
    • Result: 2D image
      • I(x, y)
  • Light field imaging
    • Samples incoming rays separately over multiple directions.
    • Preserves angular information.
    • Result: 4D light field
      • L(x,y,θ,ϕ)L(x, y, \theta, \phi)
  • Radiance field
    • Describes light at each 3D position and viewing direction.
    • L(x,y,z,θ,ϕ)L(x, y, z, \theta, \phi) → RGB
    • Conceptually extends light-field modelling from a camera plane into 3D space.
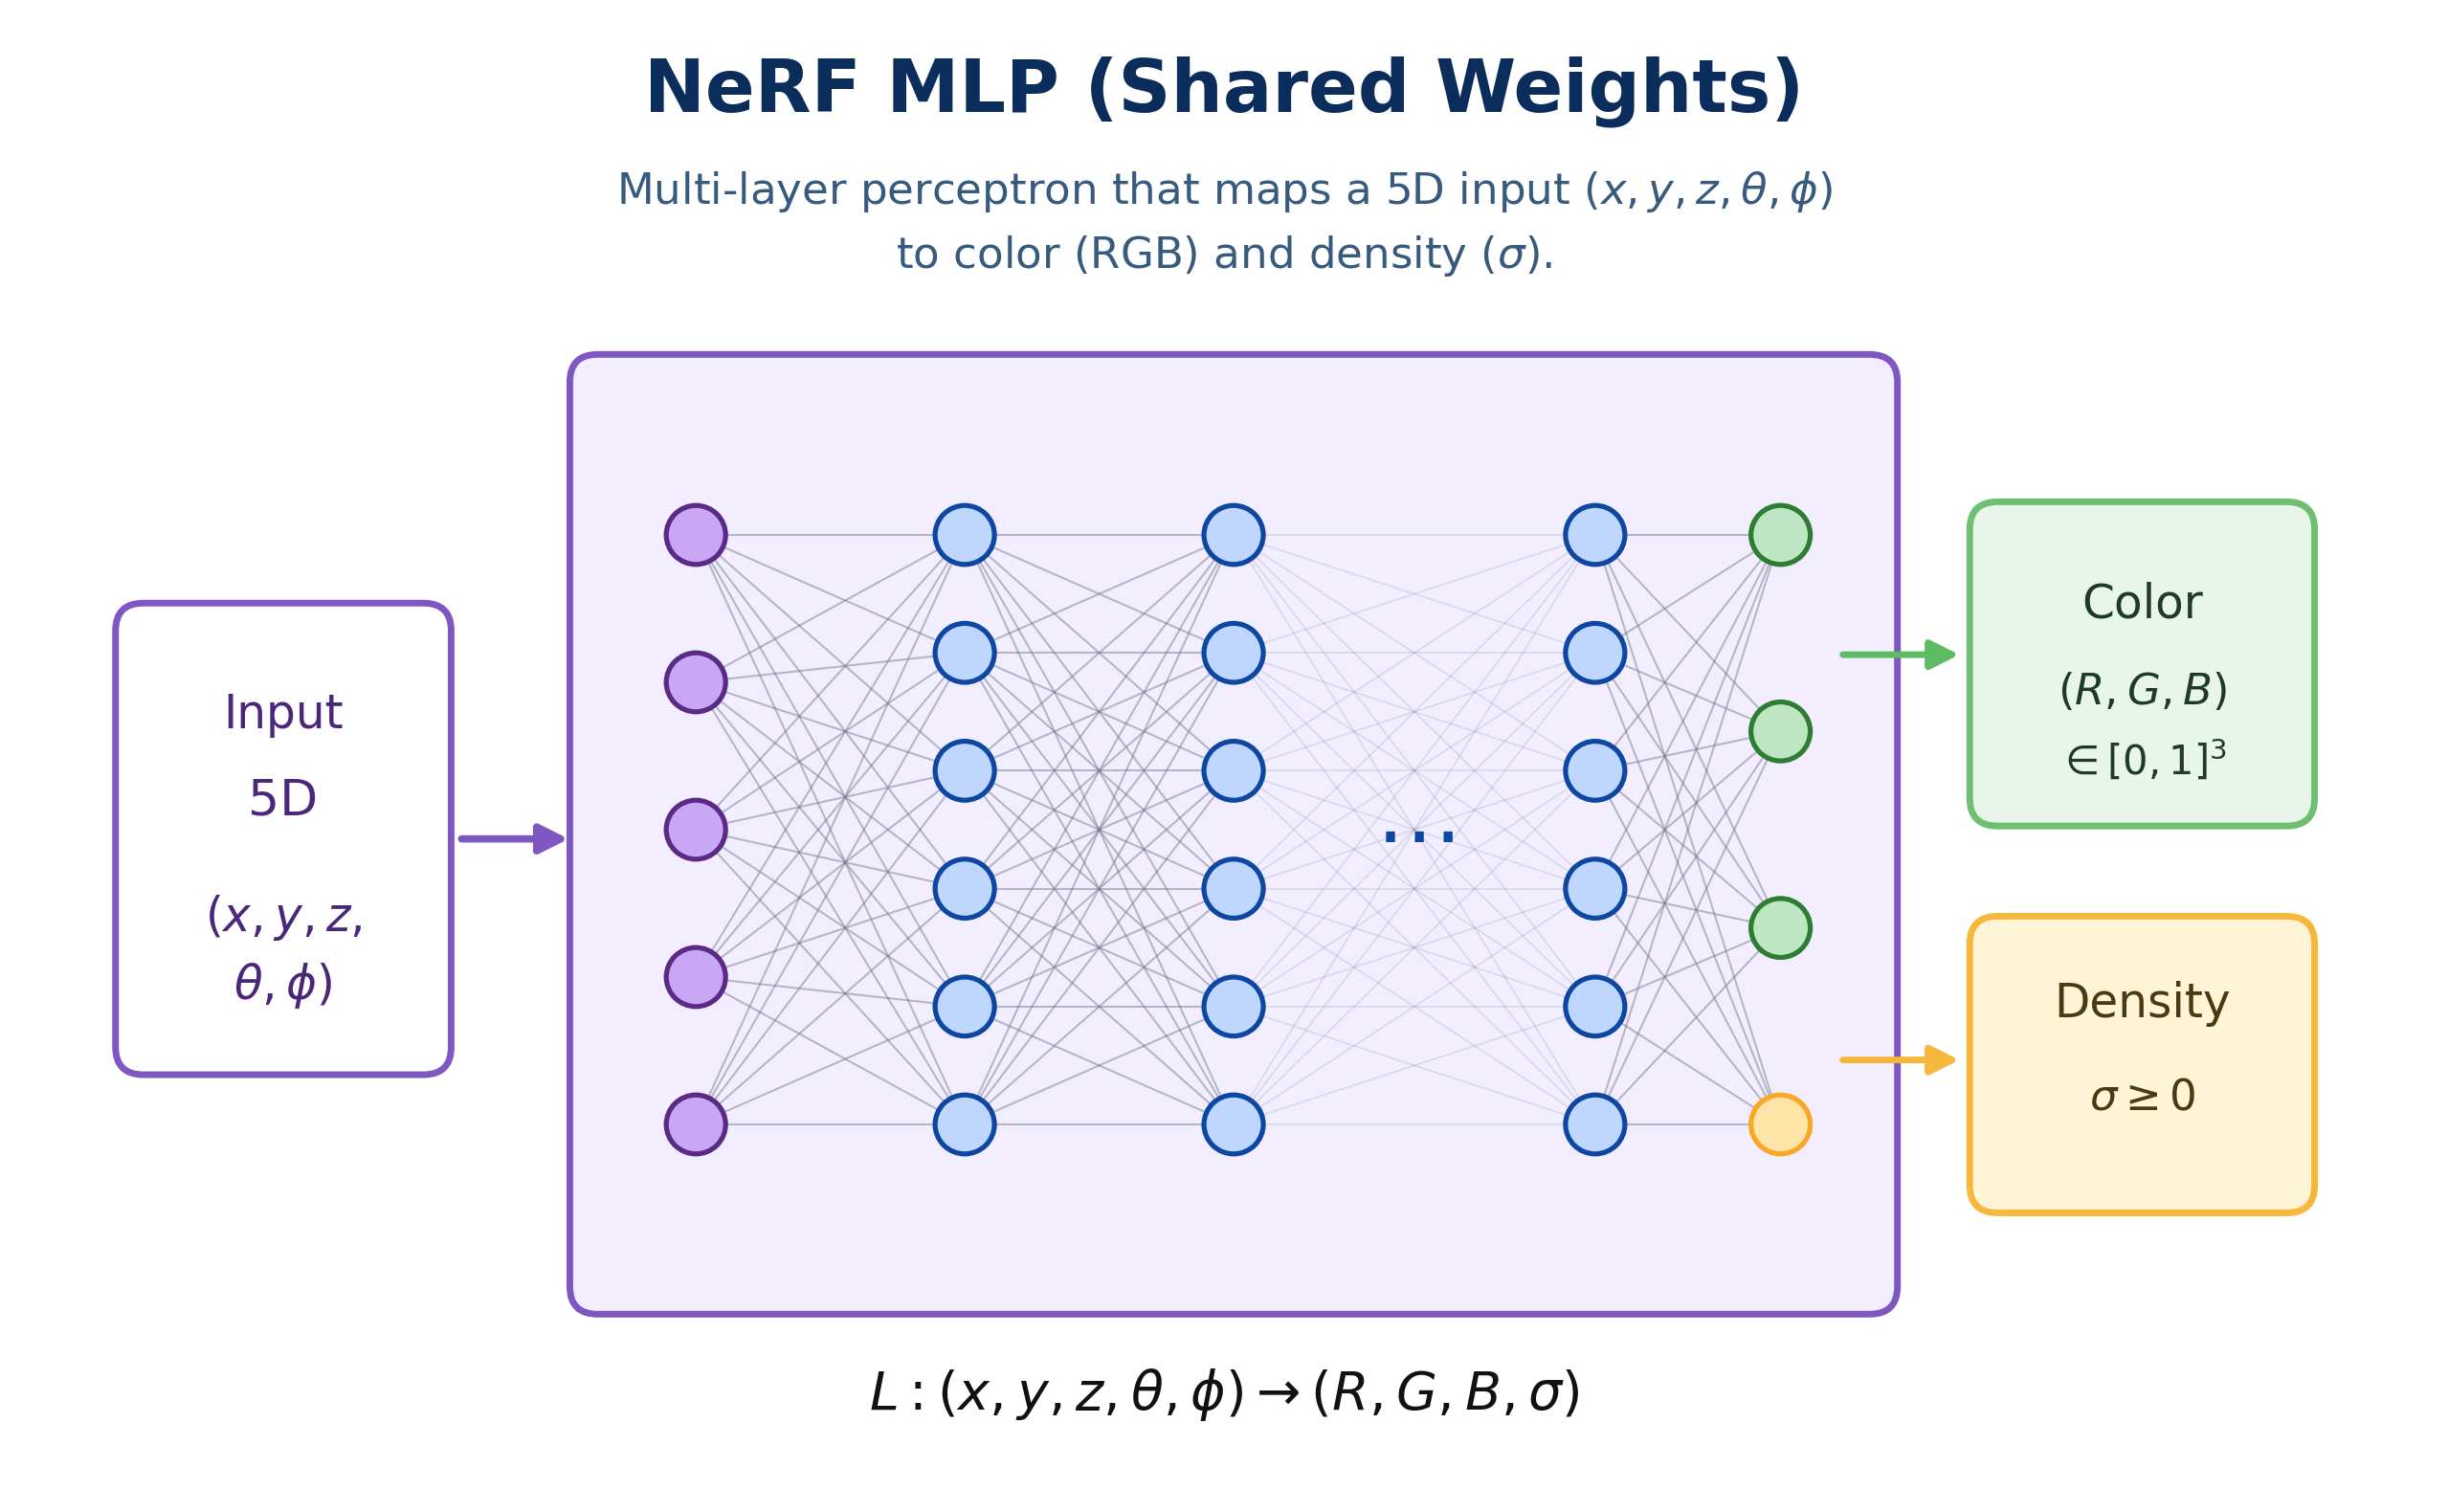
  • NeRF
    • Learns the radiance field using a neural network.
    • Input:
      • x,y,z,θ,ϕx, y, z, \theta, \phi
    • Output:
      • RGB
      • density σ\sigma
  • 3D Gaussian Splatting
    • Uses explicit Gaussian primitives instead of an MLP.
    • Adjusts position, scale, orientation, colour, opacity, etc. to represent the scene and its view-dependent appearance.
  • Conceptual shift
    • Geometry modelling → where the object is.
    • Radiance field modelling → what light is seen from each 3D position and direction.

NeRF MLP

Modern 3D Representations

NeRFs

Neural Radiance Fields

  • Light field at any point in space stored in neural network weights.
  • Trained from posed images, produces photorealistic novel views.
    • Each image has a known camera position and viewing direction.
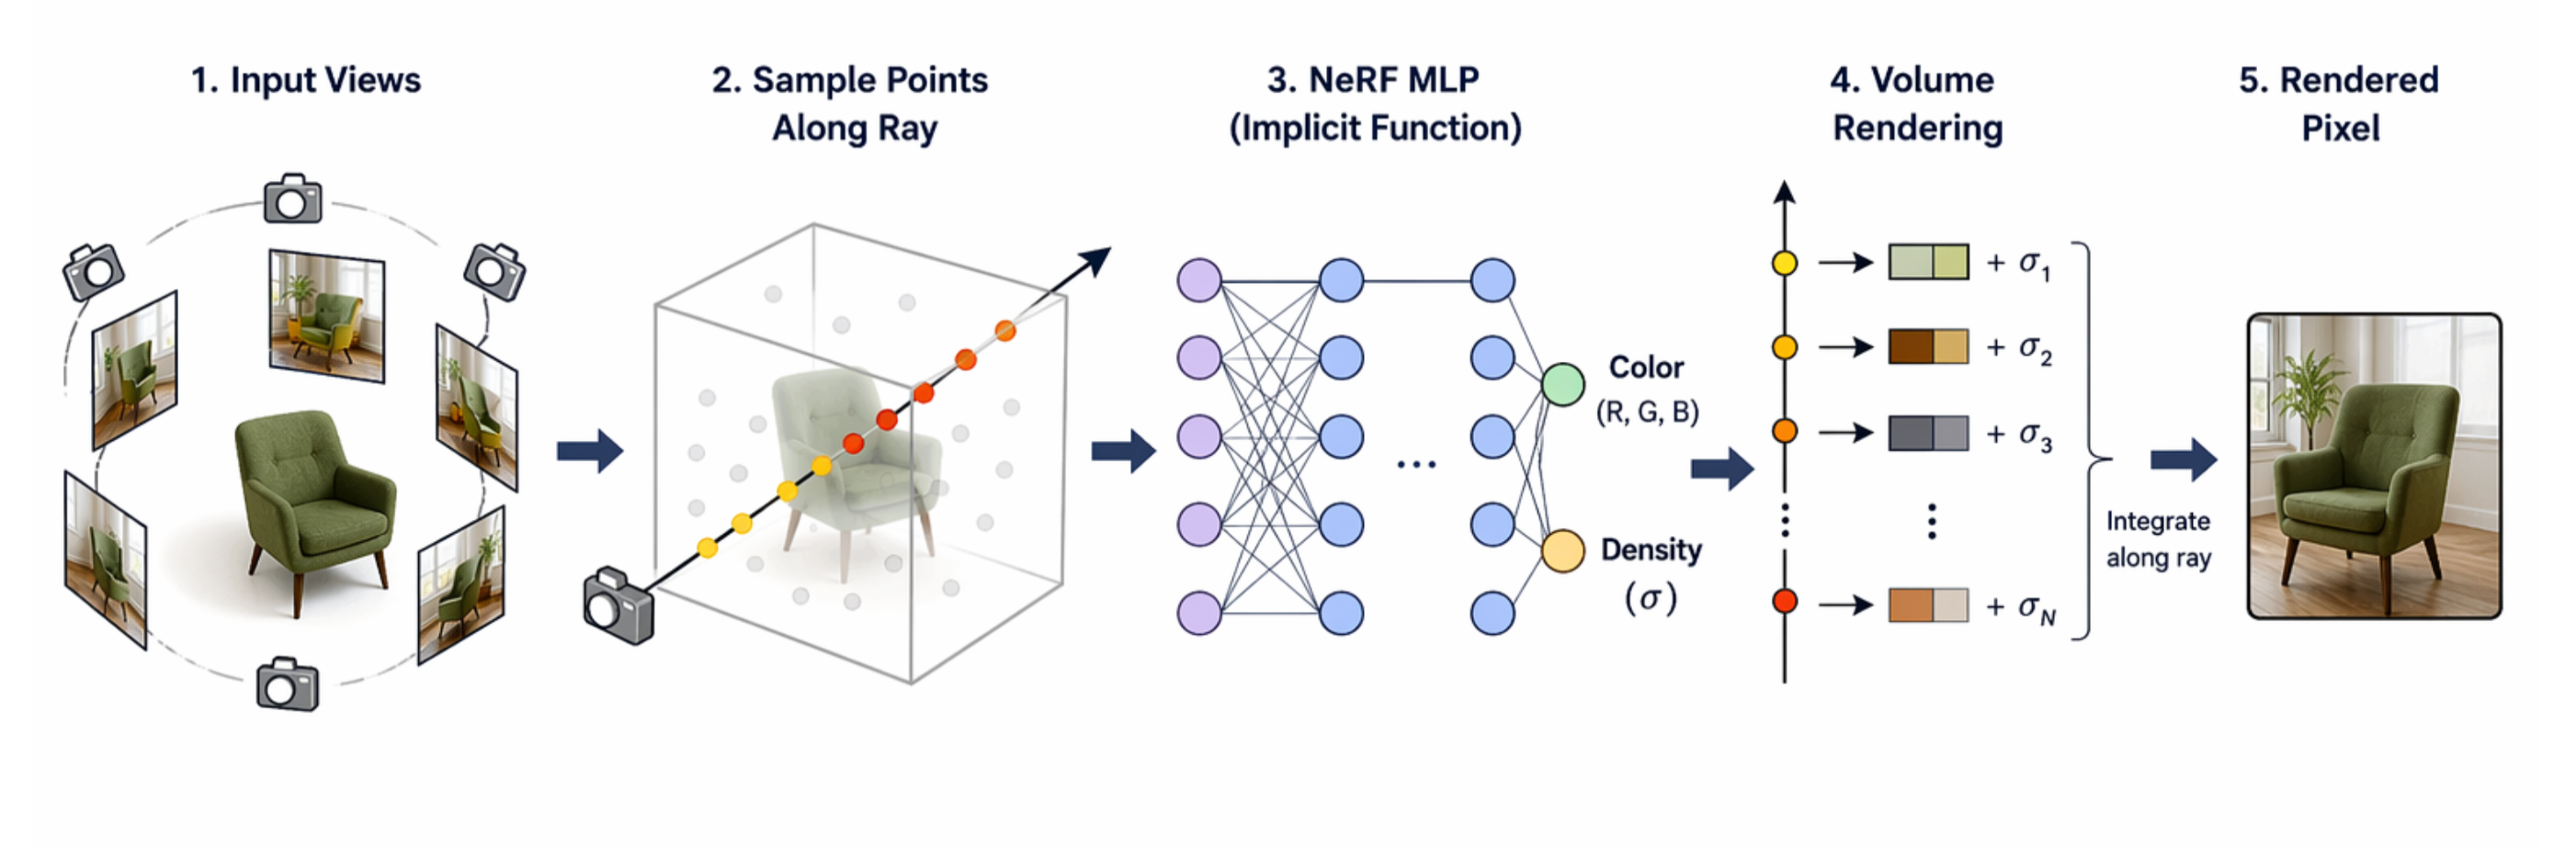
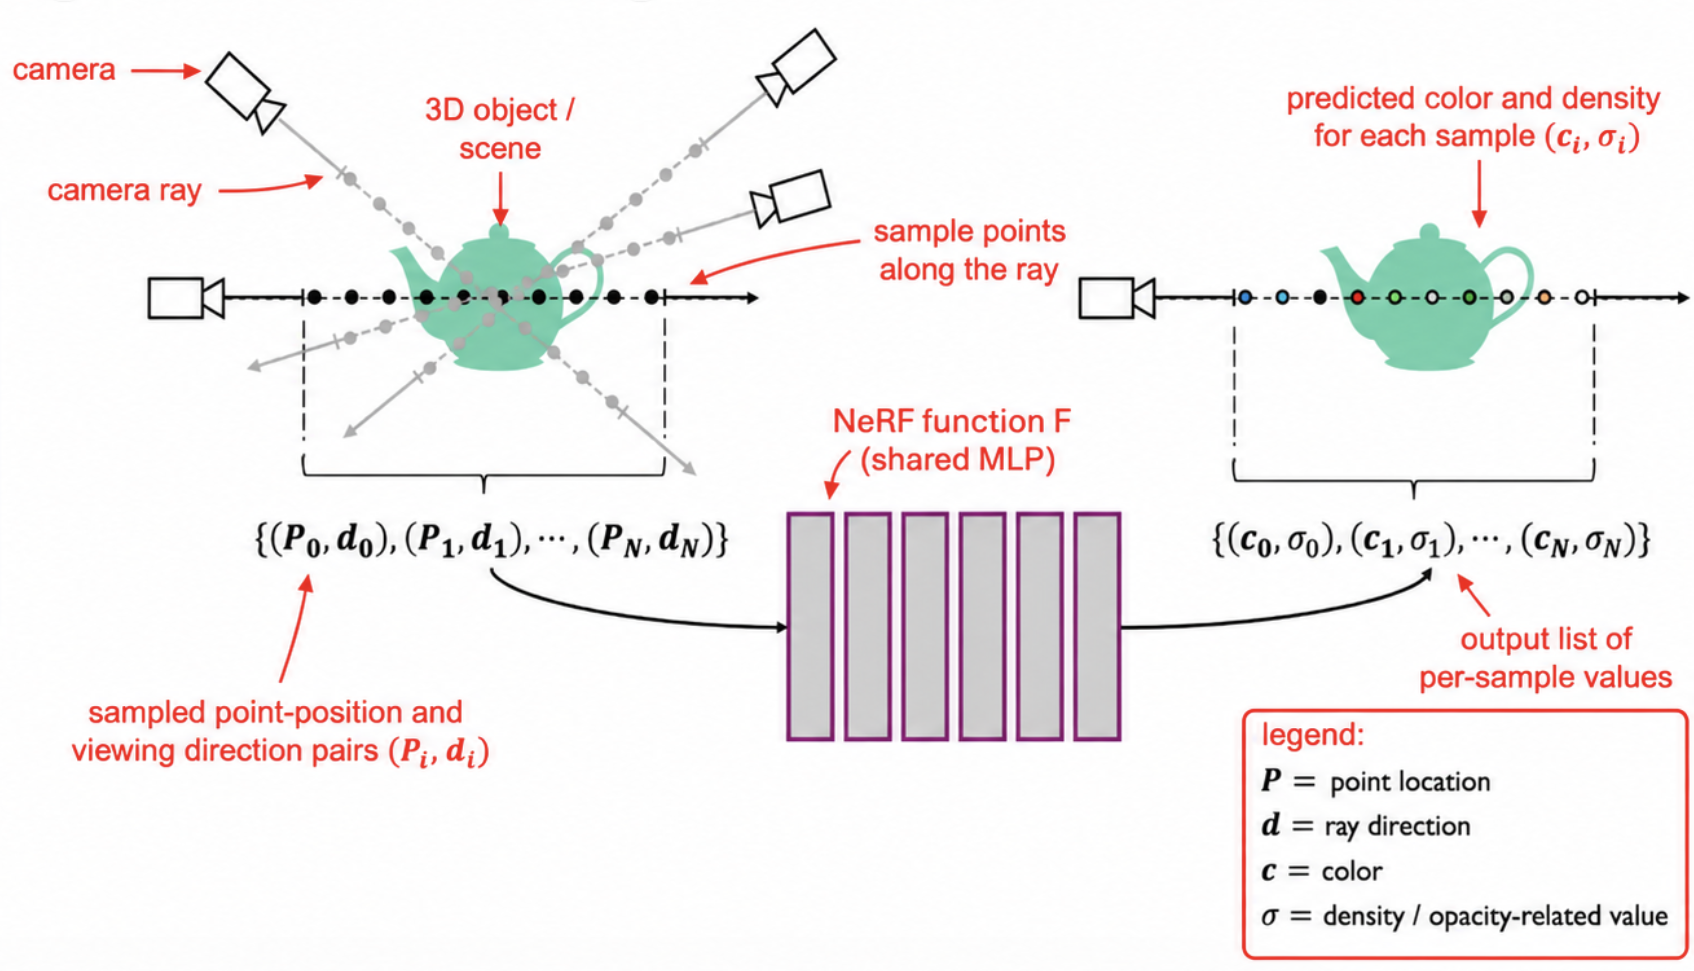
  • Rendering
    • Cast a camera ray through each image pixel.
    • Sample multiple 3D points along the ray.
    • Query the NeRF at each point to obtain color and density.
    • Empty points have low density and contribute little.
    • High-density points contribute more and can occlude points behind them.
    • Integrate the weighted colors along the ray to produce one 2D pixel.
  • NeRF Studio

NeRF Flow

NeRF Pipeline

  • Pros:
    • High photorealism/fidelity
    • Continuous scene representation
    • View-dependent effects
    • Data-efficient capture
    • Unified geometry and appearance encoding
  • Cons:
    • High computational cost
    • Slow training and rendering
    • Poor scalability
    • Entangled Geometry, appearance and rendering.

Gaussian Splatting

AspectPoint Clouds3D Gaussian Splatting (3DGS)
Spatial positionYesYes
ColorRGB, if availableRGB
OpacityNoneYes
ScaleNoneYes
OrientationNoneYes
Color directionalityNoneYes; color can vary by viewing direction
  • Instead of building objects using polygons, it represents everything using millions of tiny soft 3D shapes called Gaussians.
    • Represent scenes explicitly as a collection of Gaussian primitives, optimized directly for efficient and accurate rendering.
  • Initialization steps:
    • Initialize point clouds
    • Find central point of 3D Gaussians.
    • A covariance matrix containing shape information is calculated.
    • Added opacity to each 3D Gaussians.
  1. First, it builds a rough point cloud from images
  2. Then, replaces those points with these Gaussian blobs
  3. It will optimize them until it match original photos as closely as possible.
  • Pros:
    • Realtime rendering at interactive frame rates.
    • High-quality visual outputs with detailed textures.
    • Efficient and compact representation compared to implicit methods.
  • Cons:
    • View-dependent quality degradation: rendering quality varies significantly across different viewing angles, causing inconsistency in visual outputs.
    • Sensitivity to initialization: final rendering quality heavily depends on initial placement of Gaussians, impacting optimization stability.
    • Inefficient Gaussian distribution: Fixed-scale Gaussians may fail to adapt effectively across scenes with varying geometric complexity.
AspectNeRF3D Gaussian Splatting (3DGS)
RepresentationImplicit MLP representationExplicit set of Gaussian primitives
RenderingRay sampling and volume integrationRasterization and splatting
TrainingOptimize network weightsDirectly optimize scene parameters
SamplingDense sampling along each rayNo dense per-ray sampling
Rendering speedSlowerFast / real-time rendering

Applications of 3D Representations

  • Immersive Interaction and Communication
    • Real-world scene integration in extended reality environments
    • Telepresence and virtual communication
      • Telehealth experiences for remote consultations
    • Digital cinematography and VFX
    • Retail and virtual try-on
    • Immersive storytelling for news and events
    • Computer graphics and gaming
  • Spatial Analysis and Operational Environments
    • Simulation and navigation for autonomous systems
    • AEC (Architecture, Engineering, and Construction)
    • Industrial imaging
    • GIS (Geographic Information Systems) Inspection and Mapping
  • Scientific Visualization and Digital Heritage
    • Cultural heritage digitization
    • Medical imaging
    • Scientific modeling
    • Fluid simulation

IP 002

· 4 min read

Edge Detectors

  • Roberts, Sobel, Prewitt
    • Simple and fast
    • Must verify if they are adequate for the application
    • Sobel is often used
  • LoG, Canny
    • More sophisticated
    • LoG uses the total gradient magnitude and direction to find edges
    • Canny uses the 2nd derivative magnitude in the gradient direction
    • Canny is more accurate and most often used

Binary Morphology

  • Taking binary images and modifying them systematically to extract information about the shapes in the image.
  • A system of algebraic operations
    • conveniently process binary objects
    • elimate object shape distortions, typically due to acquisition noise
    • decomposing objects into simpler objects for easier shape characterization
  • Dilation, Erosion, Closing, Opening, Shrinking, Skeletonization, and Thinning

Dilation

AB={cENc=a+b,aA,bB}A \oplus B = \{ c \in E^N | c = a + b, a \in A, b \in B \}

# A
0 0 0 0 0 0 0
0 0 0 0 0 0 0
0 0 0 1 0 0 0
0 0 0 1 0 0 0
0 0 0 1 1 0 0
0 0 1 0 0 0 0
0 0 0 0 0 0 0

# B
1 1 1
1 1 1
1 1 1

# like stamping

# A \oplus B
0 0 0 0 0 0 0
0 0 X X X 0 0
0 0 X X X 0 0
0 0 X X X X 0
0 X X X X X 0
0 X X X 0 0 0
# A
0 0 0 0 0 0 0
0 0 0 0 0 0 0
0 0 0 1 0 0 0
0 0 0 1 0 0 0
0 0 0 1 1 0 0
0 0 1 0 0 0 0
0 0 0 0 0 0 0

# B
0 1 0
1 0 1
0 1 0

# A \oplus B
0 0 0 0 0 0 0
0 0 0 X 0 0 0
0 0 X X X 0 0
0 0 X X X 0 0
0 0 X X X X 0
0 X 0 X X 0 0
0 0 X 0 0 0 0

Erosion

AB={xENx+bA,bB}A \ominus B = \{ x \in E^N | x + b \in A, \forall b \in B \}

  • It reducs the image based on the structing element B.
  • Simple way of computing the erosion is to translate the initial image in the directions opposite of B 1s and AND the results.
  • It checks the neighboring pixels and keeps only the pixels where the entire structuring element fits within the foreground.

Opening and Closing

AB=(AB)BA \circ B = (A \ominus B) \oplus B

  • AKAA \circ K \neq A

AB=(AB)BA \bullet B = (A \oplus B) \ominus B

  • AKAA \bullet K \neq A

Controlled Erosions

  • It doesn't result in the complete removal of the object.
  • Shrinking: Repeatedly reduces an object until each connected component becomes a single point or a minimal shape.
  • Skeletonization: Reduces an object to a one-pixel-wide skeleton while preserving its overall topology and structural shape.
  • Thinning: Reduces the thickness of an object while preserving its connectivity and general shape.

Object geometrical properties

  • Area
  • Centroid
  • Perimeter pixels
  • Perimeter length
  • Circularity
    • Haralick circularity
  • Bouding box
  • Spatial moments
riceim = imread('rice.png')
imshow(riceim);

level = graythresh(riceim);
bw = imbinarize(riceim, level);
rice_level = bwlabel(bw);

rice_level_rgb = label2rgb(rice_level);
imshow(rice_level_rgb);

pl_im = imread("Alaska_Airlines_Boeing_737-898.jpg")
pl_im = imresize(pl_im, 0.25);
pl_grey = rgb2gray(pl_im);
imshow(pl_grey);

se = strel('square', 3);
pl_erode = imerode(pl_BW, se);
pl_erode = imerode(pl_erode, se);
figure(2);
imshow(pl_erode);

pl_skel = bwmorph(pl_BW, 'skel', Inf);
imshow(pl_skel);

pl_thin = bwmorph(pl_BW, 'thin', Inf);
imshow(pl_thin);

se_close = strel('disk', 20);
pl_close = imclose(pl_BW, se_close);
imshow(pl_close);

pl_skel2 = bwmorph(pl_close, 'skel', Inf);
imshow(pl_skel2);

cell_im = imread('cell.tif');
imshow(cell_im);

cell_edge = edge(cell_im, 'Sobel');
imshow(cell_edge);

se_close = strel('disk', 7);
cell_edge_close = imclose(cell_edge, se_close);
imshow(cell_edge_close);

cell_edge_close_clean = imclearborder(cell_edge_close);
imshow(cell_edge_close_clean);
figure(3);
imshow(labeloverlay(cell_im, cell_edge_close_clean));

Matching, Finding or Tracking Objects

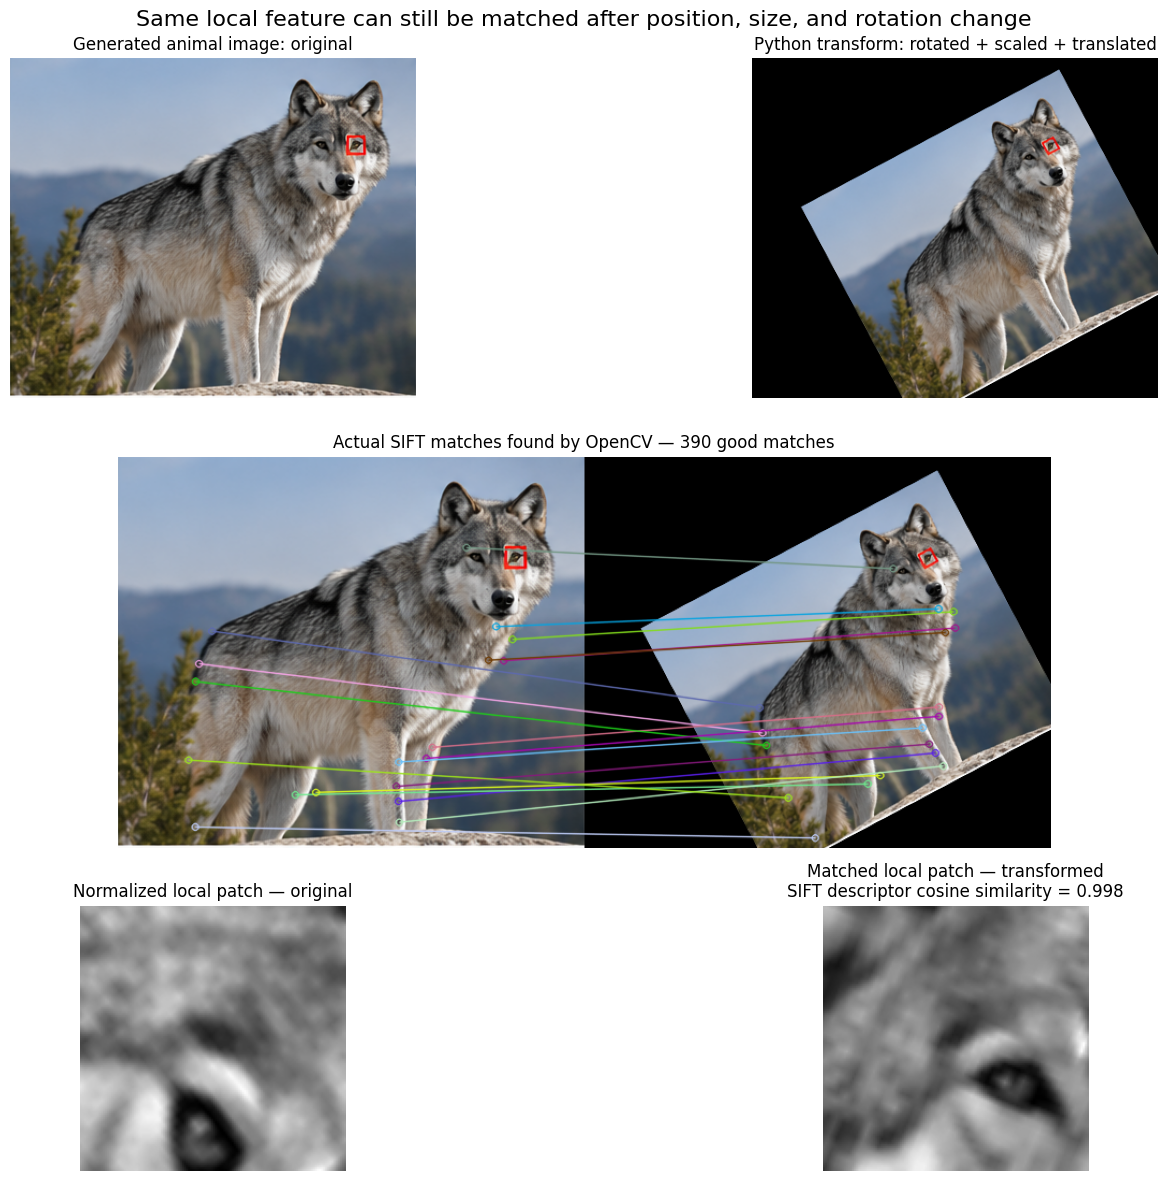
  1. Detect invarient features of the image
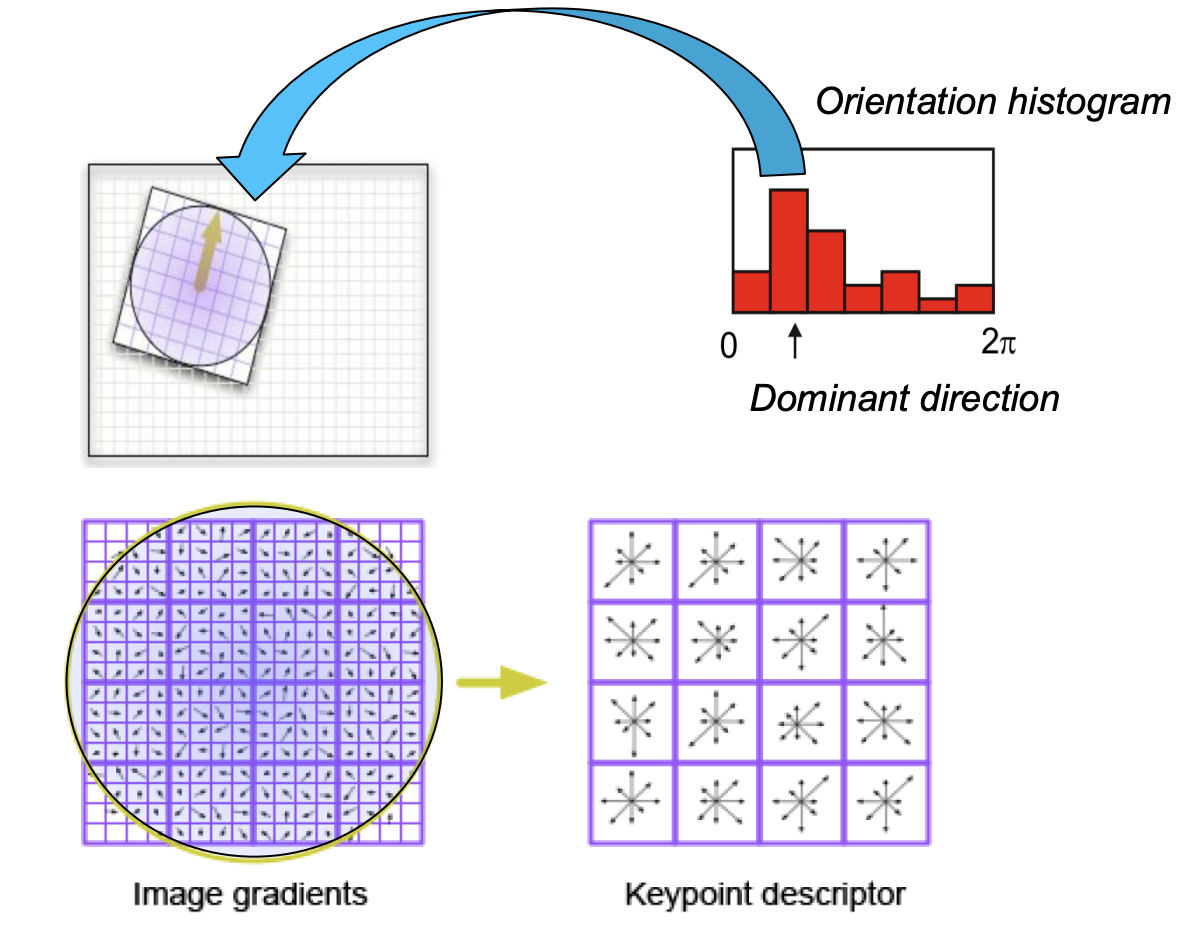
  2. Describe the local area around each feature
  3. Match patterns of the local feature descriptions

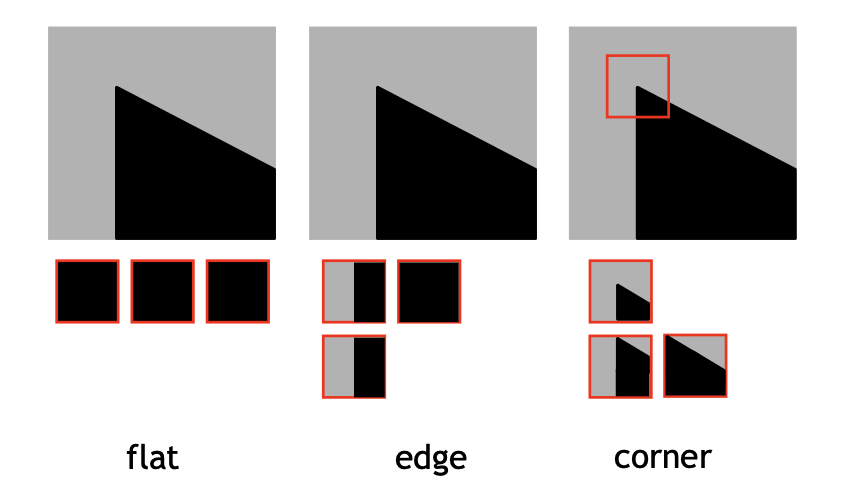
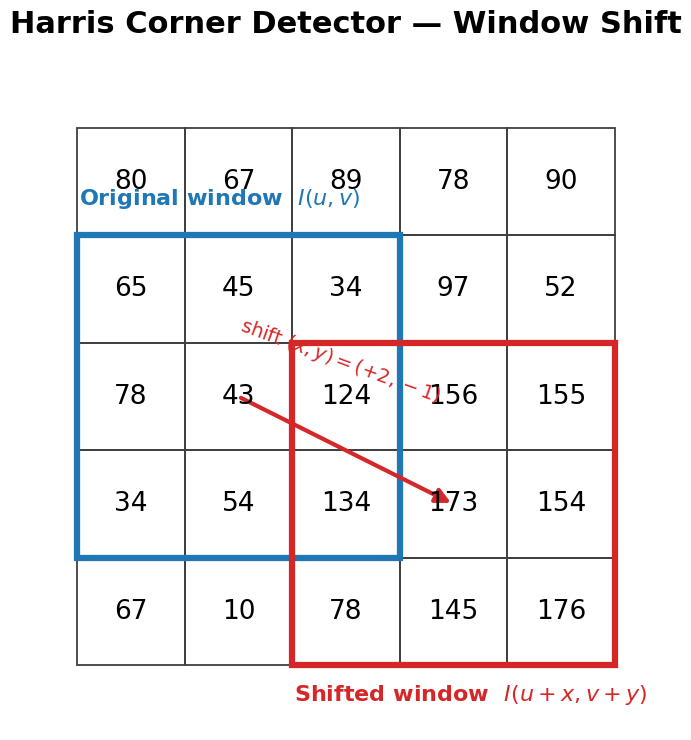
Corners

  • Invariant to rotation, translation and scaling
  • Harris corner detector is a popular method

Features

  • Detectors: detects the location of the features in an image or video
  • Descriptors: summarizes the apperance of the neighborhood.
  • Used in many applications: Tracking, object matching, stero vision, object and action recognition.

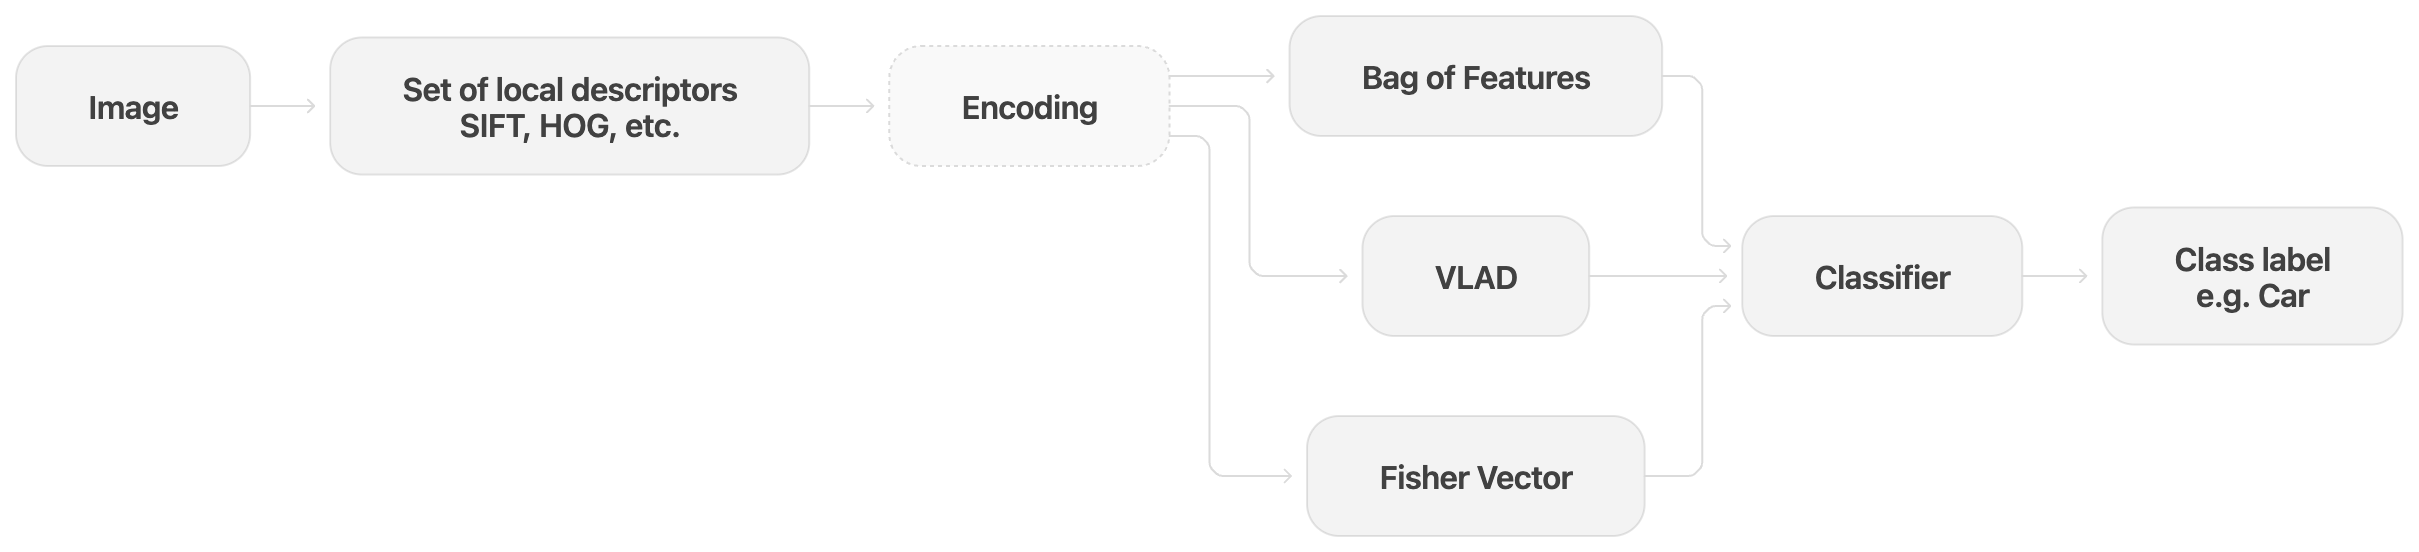
SIFT

Scale-Invariant Feature Transform

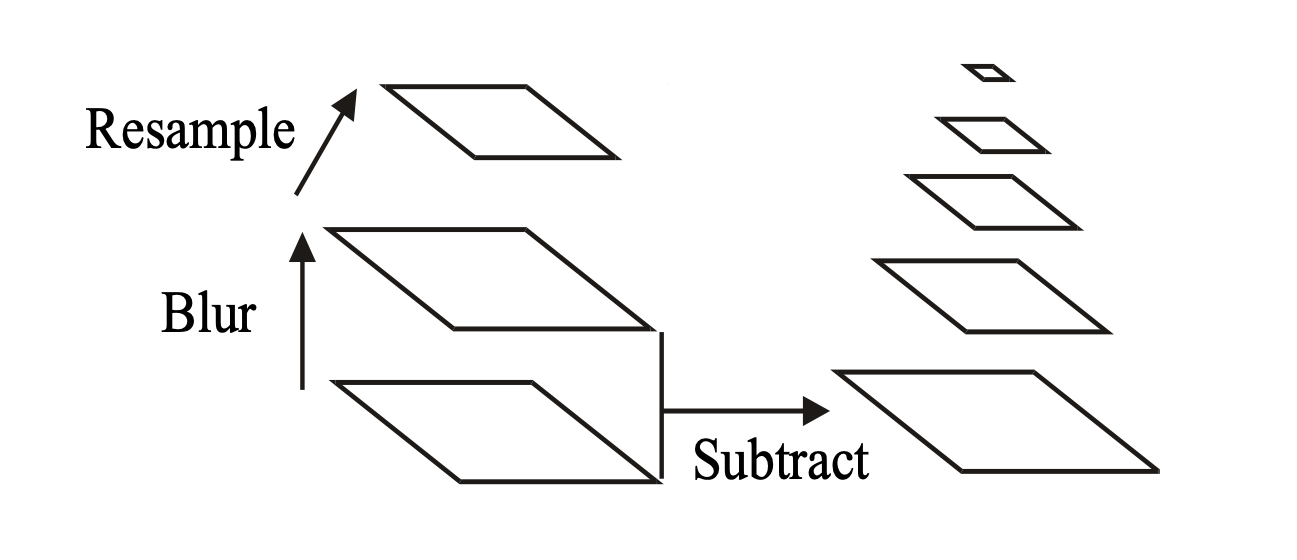
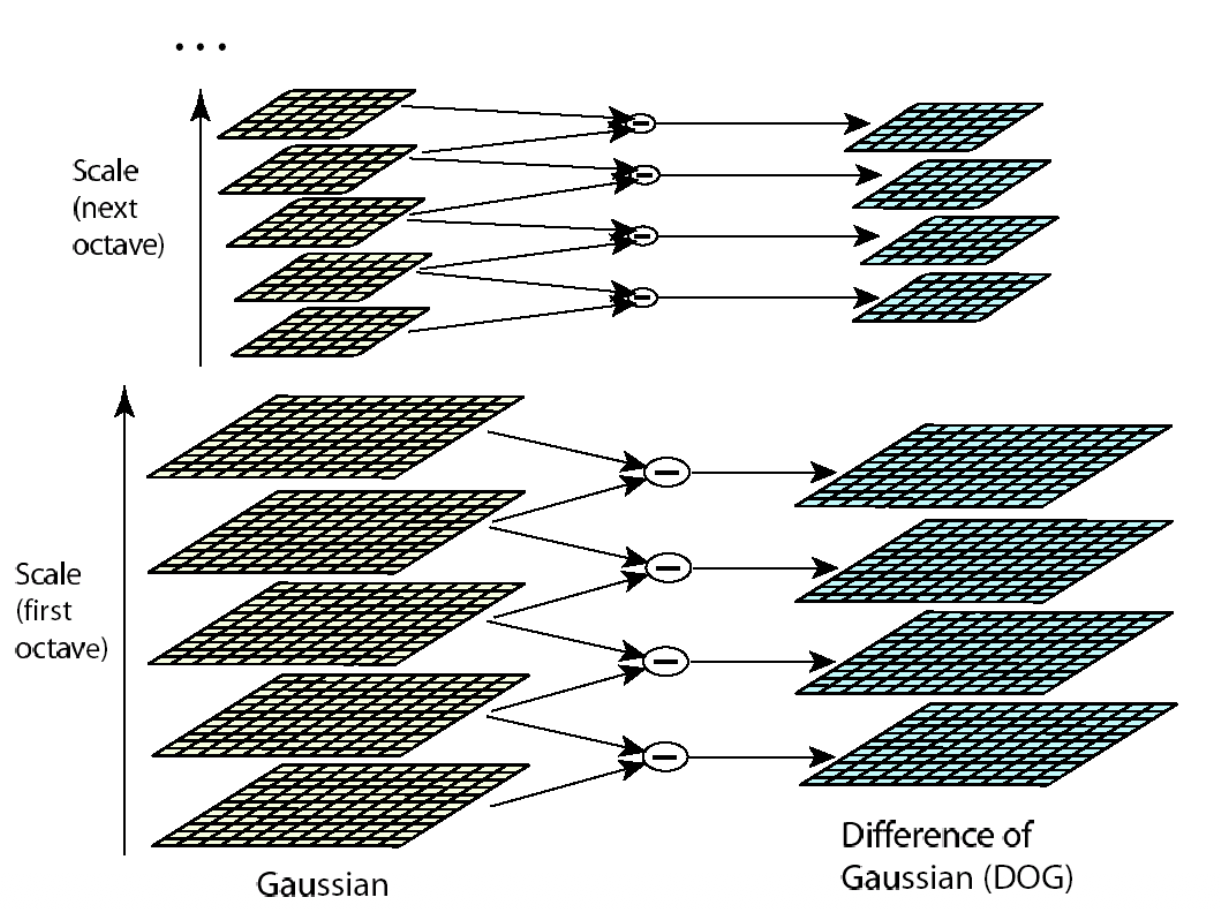
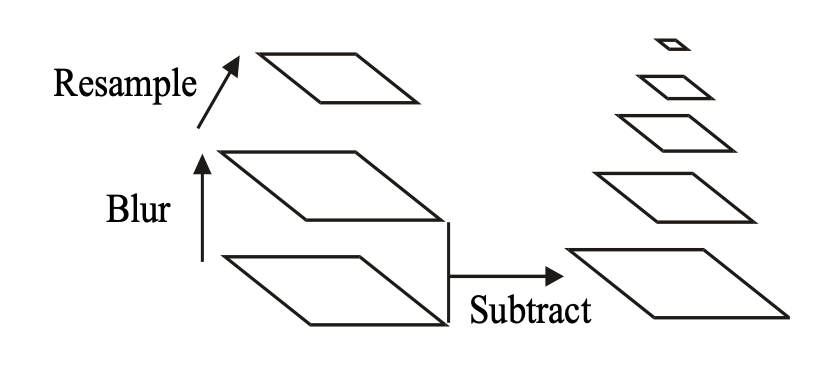
  1. Build a scale-space pyramid of Differences of Gaussians (DoG) and detect minima/maxima.
  2. Localize Keypoints
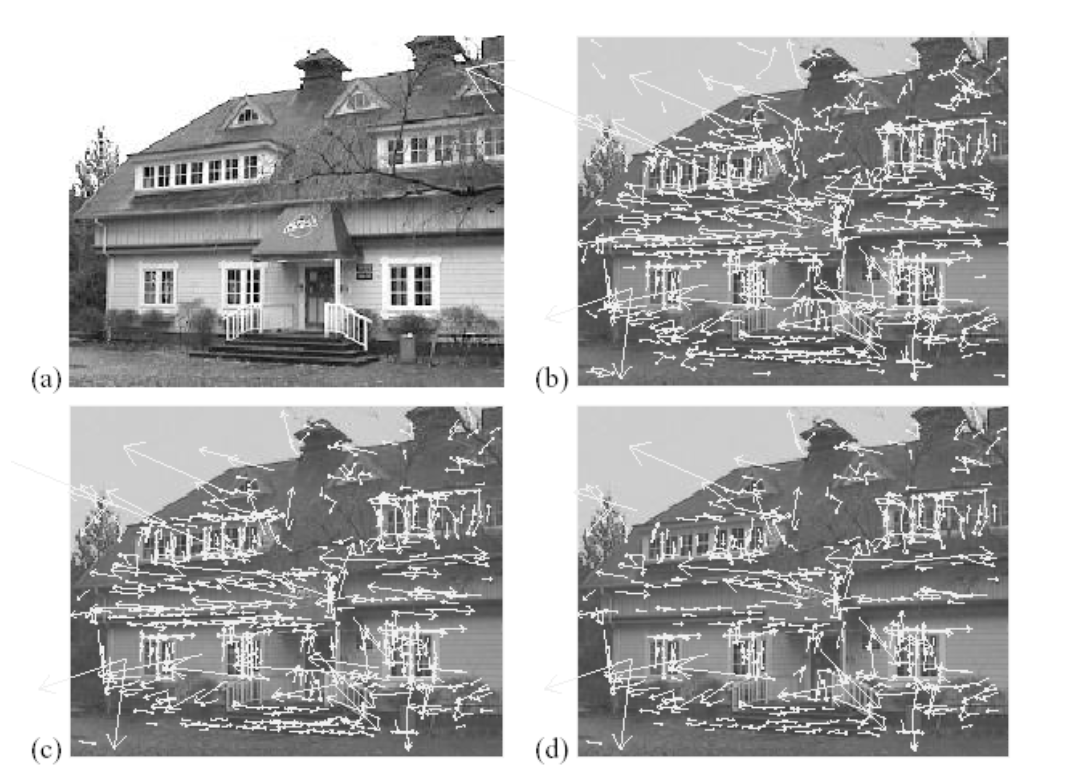
  3. Assign key point and orientation and scale
  4. Compute the SIFT descriptor at the assigned orientation and scale.

SIFT

IPPR 001

· 6 min read

Image Processing Operations

Point Operation

b[m,n]=f(a[m,n])b[m, n] = f(a[m, n])

  • It only depends on the value of the pixel itself, not on the values of its neighbors.
  • e.g. current pixel + 20.
  • to increase the brightness of an image, adjust contrast, or apply a threshold to create a binary image.

Local Operation

b[m,n]=f(a[m1,n1],a[m1,n],a[m1,n+1],a[m,n1],a[m,n],a[m,n+1],a[m+1,n1],a[m+1,n],a[m+1,n+1])b[m, n] = f(a[m - 1, n - 1], a[m - 1, n], a[m - 1, n + 1], a[m, n - 1], a[m, n], a[m, n + 1], a[m + 1, n - 1], a[m + 1, n], a[m + 1, n + 1])

  • It depends on the values of the pixel and its neighbors.
  • e.g. current pixel + average of 8 neighbors.
  • to blur an image, sharpen an image, detect edges, or convolution with a kernel.
  • The most common type of neighborhoods are:
    • 4-neighbors:
      • top, bottom, left, right.
    • 8-neighbors:
      • top, bottom, left, right, and the 4 diagonal neighbors.

Global Operation

b[m,n]=f(a[0,0],a[0,1],...,a[M1,N1])b[m, n] = f(a[0, 0], a[0, 1], ..., a[M - 1, N - 1])

  • It depends on the values of all pixels in the image.
  • e.g. current pixel + average of all pixels in the image.
  • to compute the histogram equalization, apply a global threshold, or perform a Fourier transform.

Image Histogram

  • It is a graph showing how many pixels in an image have each possible intensity value.
    • Intensity value: the brightness of a pixel.
  • e.g. 8-bit grayscale image has 256 possible intensity values (0-255).
    • The histogram will graphically display 256 numbers showing the distribution of pixels among those gray-scale values.

Histogram Equalization

0 255
|------████████--------|
80~140에 몰림

0 255
|--██--██--██--██--██--|
  • It spreads out the intensity values that are concentrated in a narrow range, increasing the contrast of the image.
  • It is useful when the images have been acquired under poor lighting conditions or have low contrast (different circumstances).

Noise

  • Any undesired information that contaminatest the image.
  • During the analog-to-digital conversion process, it is a side effect of the physical conversion of patterns of light energy into electrical patterns.
  • The shape of distribution of noise types used to describe many of them and is related closely to the histogram.

Gaussian Noise

frequency
^
| █
| █████
| █████████
| █████████████
+----------------------> noise gray level
-20 0 +20
  • The most common type of noise, with a bell-shaped distribution.
  • Natural noise process such as electronic noise in the image acquisition system.

Uniform Noise

frequency
^
| ┌───────────────┐
| │ │
| │ │
+-------┴───────────────┴------> noise intensity
a b
  • A type of noise with a distribution that is constant across the range of intensity values.
  • The gray-level values of noise are evenly distributed across a specific range.
  • It can be used to generate any toehr type of noise distribution, often used to degrade images for the evaluation of image restoration algorithms.
    • it provides the most unbiased or neutral noise model.

Salt-and-pepper noise

frequency
^
| █ █
| █ █
| █ █
+----------------------------> gray level
0 255
  • A distribution that has two spikes at the minimum and maximum intensity values.
  • The presence of single dark pixels in bright regions, or single bright pixels in dark regions.
    • Typically affects a small set of pixels.
  • It is usually quantified by the percentage of pixels which are corrupted by noise.
  • It is typically caused by errors in data transmission, faulty memory locations, or malfunctioning pixel elements in camera sensors.

Signal-to-Noise Ratio

SNR=10log10PsignalPnoiseSNR = 10 \log_{10} \frac{P_{signal}}{P_{noise}}

  • SNR
  • The ratio between the power of the signal and that of the noise.
  • In a perfect image, the ratio of signal to noise is infinite.

Noise Elimination

  • Restore the true value of the pixels as much as possibole.
  • It may undesirably reduce image information.
  • Averaging the pixel with its neighbours will smooth the noise or other types of image filters can be applied to reduce noise.

Filters

  • Linear filters: low pass, high pass
  • Non-linear filters: median
  • Filters are used to improve an image
    • if the image is destined for human viewing, to make it more pleasant to look it or more readable.
    • if the image is the input to a pattern recognition process, to facilitate the following steps of automated image analysis.

Convolution

I(r,c)F=i=12M+1j=12M+1I(r+i(M+1),c+j(M+1))F(i,j)I(r, c) \otimes F = \sum_{i=1}^{2M + 1} \sum_{j=1}^{2M+1} I(r+i-(M+1), c + j-(M+1)) F(i, j)

  • Multiply the pixels of a neighborhood of (r,c)(r, c) by the corresponding coefficients of the filter FF, and add them all together.

Low Pass Filter

  • Smoothing or softening, employes to remove high spatial frequency noise from a disital image.
  • It replace each pixwel with a weighted sum of each pixel's neighbors.
  • It is used to remove noise, might have the side-effect of generally smoothing or blurring images and reducing edge information.
  • Local averaging: take the local average of the pixels in a neighborhood and replace the center pixel with that value.

Gaussian Filter

Hij=12πσ2ei2+j22σ2H_{ij} = \frac{1}{2\pi\sigma^2} e^{-\frac{i^2 + j^2}{2\sigma^2}}

  • yields a 2k+1×2k+12k+1 \times 2k+1 kernel, where kk is the size of the filter and σ\sigma is the standard deviation of the Gaussian distribution.
  • A smoothing filter that computes a weighted average of neighboring pixels, giving larger weights to pixels closer to the center.
1 4 7 4 1
4 16 26 16 4
7 26 41 26 7
4 16 26 16 4
1 4 7 4 1
  • Smaller σ\sigma values result in a more localized filter, which means weak smoothing and less blurring of the image.
  • Larger σ\sigma values result in a more spread-out filter, which means stronger smoothing and more blurring of the image.

Median Filter

  • A non-linear filter that replaces a pixel with the median of its neighbors.
  • It is effective at removing salt-and-pepper noise and other isolated noise compared to low-pass linear filters.
  • Less blurred, edges remain sharp, removes single pixel erros completely, but slower requires sorting the pixels in the neighborhood.
10 11 10
12 255 11
10 12 11

# 255 is salt-and-pepper noise, the median of the 9 pixels is 11, so the center pixel is replaced with 11.
10, 10, 11, 11, 11, 12, 12, 255

# to-be
10, 10, 11, 11, 11, 12, 12, 11

High Pass Filter

  • It extracts high-frequency components, such as edges and fine details, by subtracting a low-pass filtered image from the original image.
  • Sometimes, it is desired to enhance the high frequencies without removing the low frequencies.
Sharpened Image = Original Image + High-frequency component
= Origial Image + (Original Image - Low-pass filtered Image)

Conclusion

  • Low-pass filter → smooth / blur
  • High-pass filter → edge / detail
  • High-pass + original → sharpening